Lightweight locks (LWLocks) are a type of interprocess lock used by PostgreSQL to coordinate simultaneous access of multiple processes to a shared memory region. There are various reasons that can cause this lock to create issues in the database. I will now provide a short yet concise demo, followed by an exploration of the nature of LWLock in PostgreSQL through reference to its source code and OS stuff.
As a first step, I will generate some load on the database using pgbench. While not extremely flexible, this tool is adequate for testing some basics. The provided inputs are as follows.
[postgres@centos8 ~]$ pgbench -c 10 -j 10 -t 100000 -S tpcc
pgbench (15.5)
starting vacuum...end.
It spawns 10 (-j) worker threads to execute 10 (-c) concurrent processes, each of which runs 100,000 read-only queries as fast as possible (this is the default, and the rate is configurable as well). Visually, it appears as follows:
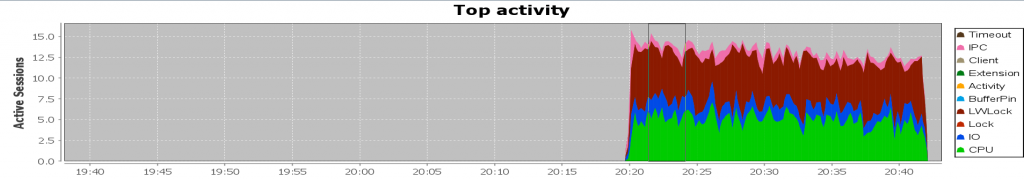
This is certainly not the behavior one would expect from a well-performing database with reasonable response times. The dark read LWLock prevails and we certainly need to bring it down. Typically, the LWLock is accompanied by I/O, as is the case here. However, this is not always the scenario, as a few other reasons may exist. Let’s assume we have no information about the database and try to figure out what is going on.
PostgreSQL introduced the pgsentinel extension, which, when loaded, samples the active sessions every second by default and makes the information available through the pg_active_session_history view. This allows querying what the sessions were doing at a particular point in time or within a range, making it very useful when diagnosing performance issues:
[postgres@centos8 home]$ ./ash wait_event_type,wait_event "backend_type='client backend'" '2023-11-24 20:29:00' '2023-11-24 20:30:00'
--------------------------------------------------------------------------------------------------------
 wait_event_type |    wait_event    | samples | sessions
-----------------+------------------+---------+----------
 CPU             | CPU              |     213 |       11
 LWLock          | BufferMapping    |     196 |       10
 IO              | DataFileRead     |      61 |       10
 IPC             | BufferIO         |      50 |       10
 IPC             | ExecuteGather    |       7 |        7
 IPC             | BgWorkerShutdown |       4 |        4
(6 rows)
This is a bash script which connects to the database and queries data from pg_active_session_history view. The first list (wait_event_type, wait_event) is the grouping columns followed by the filter, and followed by the range in which we are interested.
From the output (as well as the chart), it becomes evident that the highlighted LWLock is the culprit, with approximately 10 sessions waiting for BufferMapping. This wait event occurs when a process is waiting to map a page from the disk to a buffer in the shared buffers. Once the necessary disk page has been identified, the process must find a free buffer in the buffer pool to load the page into. This is precisely what the processes are currently awaiting. Before we proceed to rerun the script and examine additional dimensions that may be helpful, let’s draw reasonable few conclusions here.
If the process cannot find a free buffer in the buffer pool, then the most likely suspect is that the “Shared buffers is full“. The (misleading) path to take then would (or could) be something like “Well, if it is full, then let’s add up some space.” Although a feasible yet rare solution in practice, the correct approach to handling it would be to ask, ‘What is polluting it?”. Well…definitely, the queries :)). Let’s then find out what these queries look like (only top 20 rows are returned, by default).
[postgres@centos8 home]$ ./ash wait_event_type,wait_event,query "backend_type='client backend'" '2023-11-24 20:29:00' '2023-11-24 20:30:00'
--------------------------------------------------------------------------------------------------------
 wait_event_type |  wait_event   |                           query                           | samples | sessions
-----------------+---------------+-----------------------------------------------------------+---------+----------
 LWLock          | BufferMapping | SELECT abalance FROM pgbench_accounts WHERE aid = 1679538 |       5 |        1
 CPU             | CPU           | SELECT abalance FROM pgbench_accounts WHERE aid = 6508293 |       4 |        1
 LWLock          | BufferMapping | SELECT abalance FROM pgbench_accounts WHERE aid = 649929  |       4 |        1
 LWLock          | BufferMapping | SELECT abalance FROM pgbench_accounts WHERE aid = 6487070 |       4 |        1
 CPU             | CPU           | SELECT abalance FROM pgbench_accounts WHERE aid = 5088721 |       4 |        1
 CPU             | CPU           | SELECT abalance FROM pgbench_accounts WHERE aid = 9953261 |       4 |        1
 CPU             | CPU           | SELECT abalance FROM pgbench_accounts WHERE aid = 1659220 |       4 |        1
 CPU             | CPU           | SELECT abalance FROM pgbench_accounts WHERE aid = 9321817 |       3 |        1
 CPU             | CPU           | SELECT abalance FROM pgbench_accounts WHERE aid = 9104089 |       3 |        1
 IO              | DataFileRead  | SELECT abalance FROM pgbench_accounts WHERE aid = 8129419 |       3 |        1
 CPU             | CPU           | SELECT abalance FROM pgbench_accounts WHERE aid = 1997345 |       3 |        1
 CPU             | CPU           | SELECT abalance FROM pgbench_accounts WHERE aid = 1172966 |       3 |        1
 CPU             | CPU           | SELECT abalance FROM pgbench_accounts WHERE aid = 513858  |       3 |        1
 CPU             | CPU           | SELECT abalance FROM pgbench_accounts WHERE aid = 9534579 |       3 |        1
 CPU             | CPU           | SELECT abalance FROM pgbench_accounts WHERE aid = 1393497 |       3 |        1
 CPU             | CPU           | SELECT abalance FROM pgbench_accounts WHERE aid = 3166138 |       3 |        1
 CPU             | CPU           | SELECT abalance FROM pgbench_accounts WHERE aid = 3735733 |       3 |        1
 CPU             | CPU           | SELECT abalance FROM pgbench_accounts WHERE aid = 2971116 |       3 |        1
 CPU             | CPU           | SELECT abalance FROM pgbench_accounts WHERE aid = 4772208 |       3 |        1
 CPU             | CPU           | SELECT abalance FROM pgbench_accounts WHERE aid = 2960432 |       3 |        1
(20 rows)
All sessions are executing the same query but passing different literals. They look very innocent: a small point query which (apparently; because the column “aid” looks like some sort of ID) returns just a single row). Remember, we have no information about the database – nothing at all. That is, we cannot allow some names, IDs, and etc. put us on the wrong path.
We now know what is polluting the buffer pool. So, we have to see why this query polluting it. The query explain plan will show us how the details of the query execution:
tpcc=# explain (analyze, buffers) SELECT abalance FROM pgbench_accounts WHERE aid = 1679538;
                                                             QUERY PLAN
------------------------------------------------------------------------------------------------------------------------------------
 Gather  (cost=1000.00..217018.43 rows=1 width=4) (actual time=2434.719..2434.813 rows=1 loops=1)
   Workers Planned: 2
   Workers Launched: 2
   Buffers: shared hit=12678 read=151257
   ->  Parallel Seq Scan on pgbench_accounts  (cost=0.00..216018.33 rows=1 width=4) (actual time=2166.930..2423.078 rows=0 loops=3)
         Filter: (aid = 1679538)
         Rows Removed by Filter: 3333333
         Buffers: shared hit=12678 read=151257
 Planning:
   Buffers: shared hit=41 read=1
 Planning Time: 6.413 ms
 Execution Time: 2434.930 ms
(12 rows)
The query reads 151257 pages from disk to return a single row (rows=1). Luckily, 12678 are found in the shared buffer but still, 1.5k pages is way too high to spit out a single row. The other interesting aspect here is the second highlighted line: “Rows Removed by Filter: 3333333“. In actuality, the database didn’t remove this number of rows by filter. It is much more than that: 9999999. The explanation is in another LinkedIn post of mine :)).
So, the query reads lots of pages, out of which only one holds the necessary row. This is what actually pollutes the buffer. Adding an index on the filtering column will definitely make it much more better. As a result, the query will read only two pages: one from the index, another one from the table (unless the table/index is bloated). This is how things got better after the column has been indexed:
[postgres@centos8 home]$ ./ash wait_event_type,wait_event "1=1" '2023-11-24 22:00:00' '2023-11-24 22:01:00'
--------------------------------------------------------------------------------------------------------
 wait_event_type |  wait_event  | samples | sessions
-----------------+--------------+---------+----------
 Client          | ClientRead   |      36 |       10
 CPU             | CPU          |      16 |        8
 IO              | DataFileRead |      16 |        8
(3 rows)
LWLock is gone and not there anymore.
Continued…
Now that it is clear how to deal with LWLock (at least in a typical case) related waits, it is also important to understand the implementation details of it. This time, we’ll delve into the details of how it is acquired (the release should be much simpler), and what actually counts as wait duration when the lock is being waited for. The current wait interface in PostgreSQL does not expose the duration of the wait. One of the first valid approaches is to examine the functions that execute when the process attempts to acquire the lock.
Let’s sample the stack trace with pstack and see what is going on (I’ve sampled it many times in a loop for a single process but will show only the top one here.):
[root@centos8 ~]# pstack 4391
#0  0x00007fd95fd9cda6 in do_futex_wait.constprop () from /lib64/libpthread.so.0
#1  0x00007fd95fd9ce98 in __new_sem_wait_slow.constprop.0 () from /lib64/libpthread.so.0
#2  0x00000000007815a2 in PGSemaphoreLock (sema=0x7fd819711eb8) at pg_sema.c:327
#3  0x00000000007fca6c in LWLockAcquire (lock=lock@entry=0x7fd819715580, mode=mode@entry=LW_EXCLUSIVE) at lwlock.c:1315
#4  0x00000000007dbf8f in BufferAlloc (foundPtr=0x7fff9354e59b, strategy=0x1c7da98, blockNum=134785, forkNum=MAIN_FORKNUM, relpersistence=112 'p', smgr=0x1c3d8f8) at bufmgr.c:1320
#5  ReadBuffer_common (smgr=0x1c3d8f8, relpersistence=<optimized out>, forkNum=MAIN_FORKNUM, blockNum=134785, mode=RBM_NORMAL, strategy=0x1c7da98, hit=0x7fff9354e647) at bufmgr.c:873
#6  0x00000000007dc6f0 in ReadBufferExtended (reln=0x7fd96169d1f8, forkNum=forkNum@entry=MAIN_FORKNUM, blockNum=blockNum@entry=134785, mode=mode@entry=RBM_NORMAL, strategy=<optimized out>) at ../../../../src/include/utils/rel.h:560
#7  0x0000000000549c66 in heapgetpage (sscan=sscan@entry=0x1c7cd18, page=page@entry=134785) at heapam.c:402
#8  0x000000000054a1f6 in heapgettup_pagemode (scan=scan@entry=0x1c7cd18, dir=ForwardScanDirection, nkeys=0, key=0x0) at heapam.c:1120
#9  0x000000000054b162 in heap_getnextslot (sscan=0x1c7cd18, direction=<optimized out>, slot=0x1c73270) at heapam.c:1352
#10 0x00000000006cff6b in table_scan_getnextslot (slot=0x1c73270, direction=ForwardScanDirection, sscan=<optimized out>) at ../../../src/include/access/tableam.h:1046
#11 SeqNext (node=node@entry=0x1c730d0) at nodeSeqscan.c:80
#12 0x00000000006a9c52 in ExecScanFetch (recheckMtd=0x6cfeb0 <SeqRecheck>, accessMtd=0x6cfee0 <SeqNext>, node=0x1c730d0) at execScan.c:132
#13 ExecScan (node=0x1c730d0, accessMtd=0x6cfee0 <SeqNext>, recheckMtd=0x6cfeb0 <SeqRecheck>) at execScan.c:198
#14 0x00000000006ba8fa in ExecProcNode (node=0x1c730d0) at ../../../src/include/executor/executor.h:262
#15 gather_getnext (gatherstate=0x1c72ee0) at nodeGather.c:295
#16 ExecGather (pstate=0x1c72ee0) at nodeGather.c:227
Relevant lines are highlighted. The BufferAlloc function is responsible for seeking a free buffer. Once found, it will call LWLockAcquire which attempts to acquire the lock on the buffer. The remaining three functions (0, 1, and 2) suggest that the process is likely using a semaphore (in addition, some futex-related operations are also present) when it fails to acquire the lock.
What cannot be seen from here is whether the process sleeps or spins, and if it sleeps, then for how long. Tracing system calls can help us here. Their frequency and inputs can help us discern the nature of the waiting. Let’s strace it and see:
pread64(6, "\6\0\0\0(\257\250\340\0\0\4\0\f\1\200\1\0 \4 \0\0\0\0\200\237\362\0\0\237\362\0"..., 8192, 62840832) = 8192
pread64(6, "\6\0\0\0\330\311\250\340\0\0\4\0\f\1\200\1\0 \4 \0\0\0\0\200\237\362\0\0\237\362\0"..., 8192, 62849024) = 8192
futex(0x7fc549a66c38, FUTEX_WAIT_BITSET|FUTEX_CLOCK_REALTIME, 0, NULL, FUTEX_BITSET_MATCH_ANY) = 0
pread64(6, "\6\0\0\0h\343\250\340\0\0\4\0\f\1\200\1\0 \4 \0\0\0\0\200\237\362\0\0\237\362\0"..., 8192, 62857216) = 8192
pread64(6, "\6\0\0\0 \375\250\340\0\0\4\0\f\1\200\1\0 \4 \0\0\0\0\200\237\362\0\0\237\362\0"..., 8192, 62865408) = 8192
pread64(6, "\6\0\0\0\360\26\251\340\0\0\4\0\f\1\200\1\0 \4 \0\0\0\0\200\237\362\0\0\237\362\0"..., 8192, 62873600) = 8192
pread64(6, "\6\0\0\0\3000\251\340\0\0\4\0\f\1\200\1\0 \4 \0\0\0\0\200\237\362\0\0\237\362\0"..., 8192, 62881792) = 8192
pread64(6, "\6\0\0\0\220J\251\340\0\0\4\0\f\1\200\1\0 \4 \0\0\0\0\200\237\362\0\0\237\362\0"..., 8192, 62889984) = 8192
pread64(6, "\6\0\0\0`d\251\340\0\0\4\0\f\1\200\1\0 \4 \0\0\0\0\200\237\362\0\0\237\362\0"..., 8192, 62898176) = 8192
pread64(6, "\6\0\0\0\30~\251\340\0\0\4\0\f\1\200\1\0 \4 \0\0\0\0\200\237\362\0\0\237\362\0"..., 8192, 62906368) = 8192
futex(0x7fc549a66c38, FUTEX_WAIT_BITSET|FUTEX_CLOCK_REALTIME, 0, NULL, FUTEX_BITSET_MATCH_ANY) = 0
futex(0x7fc549a67038, FUTEX_WAKE, 1)    = 1
This is a portion of the trace. The futex syscall is not that frequently there. Moreover, on lines 15 and 16 there are two of them with different inputs. The one on line 15 makes the calling thread to sleep until awakened. This is because the fourth parameter, which determines the timeout of the sleep, is NULL. The next futex call wakes up a waiting thread. The third input is 1, indicating that only one thread must be awakened.
We now know how long a thread sleeps when it fails to acquire the lock — until it is woken up. Additionally, we have determined that there is either no or very little spinning.
We now peek at the source code. The call stack above shows that the LWLockAcquire is there in the lwlock.c file (irrelevant lines have been replaced with dots):
bool
LWLockAcquire(LWLock *lock, LWLockMode mode)
{
	 ....................................................................
	for (;;)
	{
		bool		mustwait;

		/*
		 * Try to grab the lock the first time, we're not in the waitqueue
		 * yet/anymore.
		 */
		mustwait = LWLockAttemptLock(lock, mode);

		if (!mustwait)
		{
			LOG_LWDEBUG("LWLockAcquire", lock, "immediately acquired lock");
			break;				/* got the lock */
		}
		/* add to the queue */
		LWLockQueueSelf(lock, mode);

		/* we're now guaranteed to be woken up if necessary */
		mustwait = LWLockAttemptLock(lock, mode);

		/* ok, grabbed the lock the second time round, need to undo queueing */
		if (!mustwait)
		{
			LOG_LWDEBUG("LWLockAcquire", lock, "acquired, undoing queue");

			LWLockDequeueSelf(lock);
			break;
		}

		/*
		 * Wait until awakened.
		 *
		 * It is possible that we get awakened for a reason other than being
		 * signaled by LWLockRelease.  If so, loop back and wait again.  Once
		 * we've gotten the LWLock, re-increment the sema by the number of
		 * additional signals received.
		 */
		LOG_LWDEBUG("LWLockAcquire", lock, "waiting");

#ifdef LWLOCK_STATS
		lwstats->block_count++;
#endif

		LWLockReportWaitStart(lock);
		if (TRACE_POSTGRESQL_LWLOCK_WAIT_START_ENABLED())
			TRACE_POSTGRESQL_LWLOCK_WAIT_START(T_NAME(lock), mode);

		for (;;)
		{
			PGSemaphoreLock(proc->sem);
			if (!proc->lwWaiting)
				break;
			extraWaits++;
		}

		/* Retrying, allow LWLockRelease to release waiters again. */
		pg_atomic_fetch_or_u32(&lock->state, LW_FLAG_RELEASE_OK);
    ....................................................................
		LWLockReportWaitEnd();

		LOG_LWDEBUG("LWLockAcquire", lock, "awakened");

		/* Now loop back and try to acquire lock again. */
		result = false;
	}
	....................................................................
	return result;
}
This is how it works. First, the process attempts to acquire the lock (line 13), and if unsuccessful, it queues itself up (line 21). The next attempt follows (line 24), and if successful, the process dequeues itself (line 31), allowing it to proceed when awakened. If it fails, it starts sleeping on a semaphore (line 55). Right before the sleep, the process registers a wait by calling LWLockReportWaitStart (line 49) and ends the wait by calling LWLockReportWaitEnd (line 64). The sleep ends when the process is awakened (line 57), and it retries to acquire the lock (line 62).
Therefore, the process of LWLock acquisition is more about sleeping than spinning. The duration of the wait is the time a process sleeps on a semaphore, excluding external waits. Just a few spins are negligible in comparison to this.
More drill-down in future post…