This post is not about troubleshooting but rather about an interesting observation. I will start with a quick intro.
Visibility map is a fork of the relation which maintains two bits: one for visible, the other for frozen tuples. These bits set per page. If all tuples in a page are visible to all active transactions, the bit is then set. If at least one tuple is not so, then the bit is not set. These bits are set by vacuum only according to the docs. Although, you will never do it in production but truncate command also resets it which makes sense.
Weird thing can pop up if to consider how visibility map can be affected by failed transactions, although, at first, this may not sound as something that makes sense. Here is a quick demo about the point.
I am creating a table and running vacuum so that to have the relation’s _vm file in place.
postgres@ubuntu:~/18/main/base/5$ ls -lh *57449*-rw------- 1 postgres postgres 8.0K May 10 18:12 57449-rw------- 1 postgres postgres 24K May 10 18:12 57449_fsm-rw------- 1 postgres postgres 8.0K May 10 18:13 57449_vm
Let’s see what the bits are when the table is empty.
postgres=# select * from pg_visibility_map('customers', 0); all_visible | all_frozen -------------+------------ f | f(1row)
Good so far: table is empty and, hence, flags not set.
The all_visible flag gets cleared when a DML runs against the table. It can also be the case that the DML in actuality does not create any invisible tuple but tracking that would be too much overhead which is why the semantic of the DML cannot be checked. The bit is reset regardless of the DML.
postgres=# vacuum customers ;VACUUMpostgres=# select * from pg_visibility_map('customers', 0); all_visible | all_frozen -------------+------------ t | t(1row)postgres=# insert into customers values (1);INSERT01postgres=# select * from pg_visibility_map('customers', 0); all_visible | all_frozen -------------+------------ f | f(1row)
The other important point here is that the DML does not have to commit to reset the flag as can be witnessed below.
The flags are set here.
postgres=# vacuum customers;VACUUMpostgres=# select * from pg_visibility_map('customers', 0); all_visible | all_frozen -------------+------------ t | t(1row)
The other transaction updates the table but does not commit
postgres=# start transaction ;START TRANSACTIONpostgres=*# update customers set id = 2where id = 1;UPDATE2
and the flags get reset.
Here is the catch about all this. Suppose, transactions accessing that table (or its individual pages) fail for some reason (it could be due to a uncaught exception, for example) for a non-trivial period of time. From the other hand, queries access the table through index-only scan which needs those bits to avoid scanning the heap. This means in-between this time (start of the failure and the next vacuum run) the queries may suffer as they will do more heap fetches which would otherwise be avoided should the transactions run smoothly.
One common performance issue in Linux systems is a program consuming unexpectedly high CPU. At first glance, high CPU usage alone doesn’t necessarily indicate a problem, but if the reason for the high usage is unclear, it warrants further investigation. One possible explanation (for the sake of this post) is that the program is spawning a large number of short-lived processes, which can overwhelm system resources.
To confirm this suspicion, we typically start with standard tools such as top and ps. However, these tools may fail to capture short-lived processes due to their transient nature.
This is where eBPF (extended Berkeley Packet Filter) and BCC (BPF Compiler Collection) come into play. eBPF allows to run safe, sandboxed programs inside the Linux kernel, giving access to powerful observability primitives with minimal overhead. BCC builds on top of eBPF to make writing these tools simpler — combining kernel instrumentation with Python interfaces for user-space interaction.
One of the tools built with BCC is execsnoop, which provides a way to monitor process execution in real-time. It traces every exec() call as it happens, allowing us to confirm if excessive process spawning is indeed the issue — even for processes that live only milliseconds.
To better understand and illustrate this behavior, I will create a small bash script that simulates the rapid spawning of short-lived processes. This script will repeatedly launch a series of lightweight commands (such as /bin/true), which execute and exit almost instantly. The goal is to mimic a real-world scenario where a program creates many subprocesses that are too short-lived to be captured reliably by standard monitoring tools.
Here is the sample Bash script:
#!/bin/bash# Filename: myloop.shwhiletrue; doforiin {1..100}; do /bin/truedonedone
BCC leverages eBPF (extended Berkeley Packet Filter), a modern in-kernel virtual machine that allows for safe, low-overhead instrumentation of the Linux kernel. Unlike ps or top, execsnoop captures every executed command as it happens, including those that exit almost immediately—making it ideal for catching short-lived processes.
To begin monitoring with execsnoop, run sudo execsnoop. This will display a real-time stream of every command that gets executed on the system, along with details such as process name, PID, parent PID, and arguments.
If you want to filter by a specific process name (e.g., the script I created earlier), you can use: sudo execsnoop -n myloop. This ensures that only executions triggered by the myloop process are shown, making it easier to focus on just the relevant events.
In one terminal, run the previously created myloop.sh script which repeatedly spawns short-lived /bin/true processes. Meanwhile, in another terminal, launch execsnoop to monitor process executions in real-time:
This command filters the output to only show executions initiated by the command named myloop. As the script runs, execsnoop will reveal each individual /bin/true execution, confirming the presence of rapid, short-lived processes that would otherwise go unnoticed using tools like ps or top. This helps validate the suspicion that the system is burdened by excessive process creation. Below is the output:
Beyond its practical utility, execsnoop is also a great educational tool for learning how BPF (Berkeley Packet Filter) programs interact with the kernel. The execsnoop script, part of the BCC (BPF Compiler Collection), is written in Python. Let’s take a brief look at the parts of its source code that matter most when it comes to tracing process executions.
The script attaches BPF programs to kernel functions related to process execution—specifically, it hooks into the syscall execve, using kprobes. This allows the BPF code to run every time a new process is executed.
At the core is the makeprobe shell function, which builds a formatted probe string to capture syscall arguments:
functionmakeprobe {func=$1kname=execsnoop_$funckprobe="p:$kname $func"i=0while (( i < argc + 1 )); dokprobe="$kprobe +0(+$(( i * offset ))(%si)):string" (( i++ ))done}
This does several things:
func=$1: Takes the kernel function name to probe, e.g., sys_execve, stub_execve, or do_execve.
kname=execsnoop_$func: Sets a unique name for the kprobe event.
kprobe=”p:$kname $func”: Begins the probe definition for the function.
Each of these offset expressions dereferences a pointer in %si, which holds a pointer to the argv[] array. So for example, +0(+8(%si)) effectively gets argv[1].
The argc and offset variables determine how many arguments to capture and how far apart they are in memory (usually 8 bytes for pointers).
Not all kernel versions expose the same symbol names. So execsnoop tries three possibilities in sequence:
If the first argument is empty (e.g., arg1=””), it marks the output as ?. Otherwise, it cleans and combines the rest of the argN fields to reconstruct the original command.
Finally, the formatted output is printed to the console using this block from the awk script:
This gives a real-time stream (or snapshot, in -d mode) of every new process execution happening on the system, with parent-child relationship and command-line arguments.
BCC (BPF Compiler Collection) provides a powerful and flexible way to trace kernel-level activity using eBPF. It allows to:
Attach to syscalls, tracepoints, and kprobes with ease
Read complex kernel/user structures safely with helper functions
Filter and process data in-kernel to reduce overhead
Send structured event data to user space for rich analysis and reporting
The execsnoop tool from BCC is a concise yet powerful example of how eBPF can be leveraged for real-time observability in Linux. By attaching kprobes to the execve syscall, capturing arguments inside a BPF program, and streaming the data to user space, it offers visibility into process executions that are often too fast to catch with traditional tools.
When diagnosing a performance problem, interpreting the flow inside of the application is as important as other aspects of the whole process, such as tools and methodology. One of the key points is to figure out what the application threads are supposed to do and how these threads communicate. Once this is established, the rest is a matter of ensuring that the figures are interpreted as they were designed to be.
The following situation was not very critical from business perspective but still was quite an interesting one. Troubleshooting scenarios like this require taking the right direction from the very beginning in the first place and asking the right questions along the way. Finding answers to these questions complements the job and typically requires a different skill-set.
The issue was related to the “hbase shell” command which simply enters the shell so that one can start submitting commands to the database. It took the shell several seconds to return.
HBase says it takes 0.012 seconds to complete which is not true (not yet sure what this figure represents but apparently it measures the time the main thread assigns the job to one of its clones – details below). It was interesting to see how much time it approximately takes to execute:
The real figure represents the (almost) actual execution time, and the user represents time spent in the user space. The output (highlighted lines) tells us that it is purely application related since the majority of the time is spent in the user-space. This is why I have to focus on the application (behavior !!!) rather than analyze the execution in the kernel layer. The first question that comes to the mind is this: “How come thereal execution time is less than the time in the user-space?”. Apparently, more than one thread is involved in the command execution and the time is simply summed up across the threads which is why it is greater than the actual time.
To analyze the application behavior one can use the strace tool. This is a widely known one, although not the best one to measure performance. Still, it provides insights into application behavior since it traces the syscalls which application issues to interact with OS. strace has also flags which dumps the thread syscalls, if any. I will use the –f (for threads), – r (for timestamp) and –T(for duration) flags and rerun the “hbase shell” command this time tracing it with strace and dumping the result to a file for further analysis.
Here is the awk script which sorts the syscalls by the duration:
The second column is the process/thread id. This output indicates two things: 1) it is indeed a multithreaded process and 2) slowness is the futex-related syscalls. This “futex resumed” shows that a futex syscall is still unfinished.
Futexes are synchronization mechanisms and serve the purpose of the inter-process communication: one process starts sleeping on the futex until a certain task is completed which is when the sleeping process wakes up and continues execution. That is why I now have to focus on the futex related syscalls to analyze which I will check what relevant syscalls the main process issues (the latter is this 26999 from the output which is easy to confirm from the dump):
The thread 27387 is not what I am looking for. In all other cases futex syscalls complete fast but this one “futex(0x7f78c05ce9d0, FUTEX_WAIT, 27352, NULL <unfinished…>” not yet finished. When the second parameter of the futex syscall is FUTEX_WAIT, it will check if the value at the address 0x7f78c05ce9d0 still contains the value of 27352 in which case it blocks until (if the fourth parameter is NULL) the FUTEX_WAKE operation is done on it by another futex syscall. This indicates one interesting point: “Apparently, the FUTEX_WAKE futex syscall completes late, otherwise, the main thread which is the issuer of the FUTEX_WAIT would have completed its job and return“.
The game-changing question now becomes this: “Which of the threads is responsible for theFUTEX_WAKEfutex syscall?” If this is found, then what would remain is to analyze what this particular thread is busy with which causes it to issue the the futex syscall with FUTEX_WAKE late.
So, the futex word is 27352 and whoever the FUTEX_WAKE issuer is, it is this thread which will updated the futex word at the 0x7f78c05ce9d0 address so that the FUTEX_WAITissue can detect it and resume… and 27352 very much resembles a thread id. If it is indeed so, then there has to be the clone/fork syscall issued by the main process 26999:
If the main process waits for the futex word to become 27352 and this is the id of one of its child process, then the main one must have assigned the job to exactly this child and the child is responsible for issuing the FUTEX_WAKE. Thus, it is this thread 27352 which comes back late which can happen for one of the either reasons: it issues excessive number of syscalls or has a couple of syscalls that take the most amount of time.
Let’s check out the first case. The script below will group by the syscall name and print number of occurrences for each:
awk'{ syscall_name = substr($3, 1, index($3, "(") - 1); syscall_count[syscall_name]++ } END { for (syscall_name in syscall_count) order[syscall_count[syscall_name], syscall_name] = syscall_name; PROCINFO["sorted_in"] = "@ind_num_desc"; i = 0; for (j in order) { print order[j], syscall_count[order[j]]; i++; if (i == 10) break; } }'stracenewstat330179futex49207read25507lseek23337lstat17729rt_sigprocmask6369close5688mprotect5046mmap2425
The thread 27352 issues lots of stat syscalls for some reason. The total number of the syscalls in the dump is 425896. So, 330179/425896 ~ 78% of the job is on this guy 27352. These are the sample calls:
Lightweight locks (LWLocks) are a type of interprocess lock used by PostgreSQL to coordinate simultaneous access of multiple processes to a shared memory region. There are various reasons that can cause this lock to create issues in the database. I will now provide a short yet concise demo, followed by an exploration of the nature of LWLock in PostgreSQL through reference to its source code and OS stuff.
As a first step, I will generate some load on the database using pgbench. While not extremely flexible, this tool is adequate for testing some basics. The provided inputs are as follows.
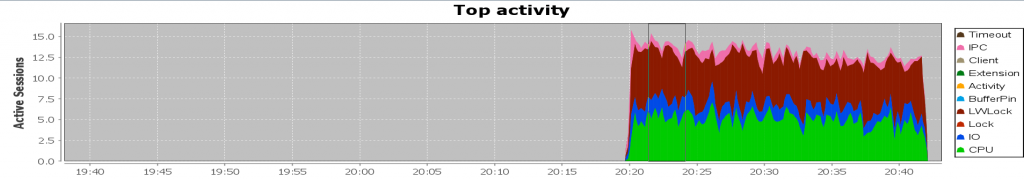
It spawns 10 (-j) worker threads to execute 10 (-c) concurrent processes, each of which runs 100,000 read-only queries as fast as possible (this is the default, and the rate is configurable as well). Visually, it appears as follows:
This is certainly not the behavior one would expect from a well-performing database with reasonable response times. The dark read LWLock prevails and we certainly need to bring it down. Typically, the LWLock is accompanied by I/O, as is the case here. However, this is not always the scenario, as a few other reasons may exist. Let’s assume we have no information about the database and try to figure out what is going on.
PostgreSQL introduced the pgsentinel extension, which, when loaded, samples the active sessions every second by default and makes the information available through the pg_active_session_history view. This allows querying what the sessions were doing at a particular point in time or within a range, making it very useful when diagnosing performance issues:
This is a bash script which connects to the database and queries data from pg_active_session_history view. The first list (wait_event_type, wait_event) is the grouping columns followed by the filter, and followed by the range in which we are interested.
From the output (as well as the chart), it becomes evident that the highlighted LWLock is the culprit, with approximately 10 sessions waiting for BufferMapping. This wait event occurs when a process is waiting to map a page from the disk to a buffer in the shared buffers. Once the necessary disk page has been identified, the process must find a free buffer in the buffer pool to load the page into. This is precisely what the processes are currently awaiting. Before we proceed to rerun the script and examine additional dimensions that may be helpful, let’s draw reasonable few conclusions here.
If the process cannot find a free buffer in the buffer pool, then the most likely suspect is that the “Shared buffers is full“. The (misleading) path to take then would (or could) be something like “Well, if it is full, then let’s add up some space.” Although a feasible yet rare solution in practice, the correct approach to handling it would be to ask, ‘What is polluting it?”. Well…definitely, the queries :)). Let’s then find out what these queries look like (only top 20 rows are returned, by default).
[postgres@centos8 home]$ ./ash wait_event_type,wait_event,query "backend_type='client backend'"'2023-11-24 20:29:00''2023-11-24 20:30:00'-------------------------------------------------------------------------------------------------------- wait_event_type | wait_event | query | samples | sessions-----------------+---------------+-----------------------------------------------------------+---------+---------- LWLock | BufferMapping | SELECT abalance FROM pgbench_accounts WHERE aid =1679538 | 5 | 1 CPU | CPU | SELECT abalance FROM pgbench_accounts WHERE aid =6508293 | 4 | 1 LWLock | BufferMapping | SELECT abalance FROM pgbench_accounts WHERE aid =649929 | 4 | 1 LWLock | BufferMapping | SELECT abalance FROM pgbench_accounts WHERE aid =6487070 | 4 | 1 CPU | CPU | SELECT abalance FROM pgbench_accounts WHERE aid =5088721 | 4 | 1 CPU | CPU | SELECT abalance FROM pgbench_accounts WHERE aid =9953261 | 4 | 1 CPU | CPU | SELECT abalance FROM pgbench_accounts WHERE aid =1659220 | 4 | 1 CPU | CPU | SELECT abalance FROM pgbench_accounts WHERE aid =9321817 | 3 | 1 CPU | CPU | SELECT abalance FROM pgbench_accounts WHERE aid =9104089 | 3 | 1IO | DataFileRead | SELECT abalance FROM pgbench_accounts WHERE aid =8129419 | 3 | 1 CPU | CPU | SELECT abalance FROM pgbench_accounts WHERE aid =1997345 | 3 | 1 CPU | CPU | SELECT abalance FROM pgbench_accounts WHERE aid =1172966 | 3 | 1 CPU | CPU | SELECT abalance FROM pgbench_accounts WHERE aid =513858 | 3 | 1 CPU | CPU | SELECT abalance FROM pgbench_accounts WHERE aid =9534579 | 3 | 1 CPU | CPU | SELECT abalance FROM pgbench_accounts WHERE aid =1393497 | 3 | 1 CPU | CPU | SELECT abalance FROM pgbench_accounts WHERE aid =3166138 | 3 | 1 CPU | CPU | SELECT abalance FROM pgbench_accounts WHERE aid =3735733 | 3 | 1 CPU | CPU | SELECT abalance FROM pgbench_accounts WHERE aid =2971116 | 3 | 1 CPU | CPU | SELECT abalance FROM pgbench_accounts WHERE aid =4772208 | 3 | 1 CPU | CPU | SELECT abalance FROM pgbench_accounts WHERE aid =2960432 | 3 | 1(20rows)
All sessions are executing the same query but passing different literals. They look very innocent: a small point query which (apparently; because the column “aid” looks like some sort of ID) returns just a single row). Remember, we have no information about the database – nothing at all. That is, we cannot allow some names, IDs, and etc. put us on the wrong path.
We now know what is polluting the buffer pool. So, we have to see why this query polluting it. The query explain plan will show us how the details of the query execution:
tpcc=# explain (analyze, buffers) SELECT abalance FROM pgbench_accounts WHERE aid =1679538; QUERY PLAN ------------------------------------------------------------------------------------------------------------------------------------ Gather (cost=1000.00..217018.43rows=1 width=4) (actual time=2434.719..2434.813rows=1 loops=1) Workers Planned: 2 Workers Launched: 2 Buffers: shared hit=12678read=151257-> Parallel Seq Scan on pgbench_accounts (cost=0.00..216018.33rows=1 width=4) (actual time=2166.930..2423.078rows=0 loops=3)Filter: (aid =1679538)Rows Removed byFilter: 3333333 Buffers: shared hit=12678read=151257 Planning: Buffers: shared hit=41read=1 Planning Time: 6.413 ms Execution Time: 2434.930 ms(12rows)
The query reads 151257 pages from disk to return a single row (rows=1). Luckily, 12678 are found in the shared buffer but still, 1.5k pages is way too high to spit out a single row. The other interesting aspect here is the second highlighted line: “Rows Removed by Filter: 3333333“. In actuality, the database didn’t remove this number of rows by filter. It is much more than that: 9999999. The explanation is in another LinkedIn post of mine :)).
So, the query reads lots of pages, out of which only one holds the necessary row. This is what actually pollutes the buffer. Adding an index on the filtering column will definitely make it much more better. As a result, the query will read only two pages: one from the index, another one from the table (unless the table/index is bloated). This is how things got better after the column has been indexed:
Continued… Now that it is clear how to deal with LWLock (at least in a typical case) related waits, it is also important to understand the implementation details of it. This time, we’ll delve into the details of how it is acquired (the release should be much simpler), and what actually counts as wait duration when the lock is being waited for. The current wait interface in PostgreSQL does not expose the duration of the wait. One of the first valid approaches is to examine the functions that execute when the process attempts to acquire the lock.
Let’s sample the stack trace with pstack and see what is going on (I’ve sampled it many times in a loop for a single process but will show only the top one here.):
[root@centos8 ~]# pstack 4391#0 0x00007fd95fd9cda6 in do_futex_wait.constprop () from /lib64/libpthread.so.0#1 0x00007fd95fd9ce98 in __new_sem_wait_slow.constprop.0 () from /lib64/libpthread.so.0#2 0x00000000007815a2 in PGSemaphoreLock (sema=0x7fd819711eb8) at pg_sema.c:327#3 0x00000000007fca6c in LWLockAcquire (lock=lock@entry=0x7fd819715580, mode=mode@entry=LW_EXCLUSIVE) at lwlock.c:1315#4 0x00000000007dbf8f in BufferAlloc (foundPtr=0x7fff9354e59b, strategy=0x1c7da98, blockNum=134785, forkNum=MAIN_FORKNUM, relpersistence=112 'p', smgr=0x1c3d8f8) at bufmgr.c:1320#5 ReadBuffer_common (smgr=0x1c3d8f8, relpersistence=<optimized out>, forkNum=MAIN_FORKNUM, blockNum=134785, mode=RBM_NORMAL, strategy=0x1c7da98, hit=0x7fff9354e647) at bufmgr.c:873#6 0x00000000007dc6f0 in ReadBufferExtended (reln=0x7fd96169d1f8, forkNum=forkNum@entry=MAIN_FORKNUM, blockNum=blockNum@entry=134785, mode=mode@entry=RBM_NORMAL, strategy=<optimized out>) at ../../../../src/include/utils/rel.h:560#7 0x0000000000549c66 in heapgetpage (sscan=sscan@entry=0x1c7cd18, page=page@entry=134785) at heapam.c:402#8 0x000000000054a1f6 in heapgettup_pagemode (scan=scan@entry=0x1c7cd18, dir=ForwardScanDirection, nkeys=0, key=0x0) at heapam.c:1120#9 0x000000000054b162 in heap_getnextslot (sscan=0x1c7cd18, direction=<optimized out>, slot=0x1c73270) at heapam.c:1352#10 0x00000000006cff6b in table_scan_getnextslot (slot=0x1c73270, direction=ForwardScanDirection, sscan=<optimized out>) at ../../../src/include/access/tableam.h:1046#11 SeqNext (node=node@entry=0x1c730d0) at nodeSeqscan.c:80#12 0x00000000006a9c52 in ExecScanFetch (recheckMtd=0x6cfeb0 <SeqRecheck>, accessMtd=0x6cfee0 <SeqNext>, node=0x1c730d0) at execScan.c:132#13 ExecScan (node=0x1c730d0, accessMtd=0x6cfee0 <SeqNext>, recheckMtd=0x6cfeb0 <SeqRecheck>) at execScan.c:198#14 0x00000000006ba8fa in ExecProcNode (node=0x1c730d0) at ../../../src/include/executor/executor.h:262#15 gather_getnext (gatherstate=0x1c72ee0) at nodeGather.c:295#16 ExecGather (pstate=0x1c72ee0) at nodeGather.c:227
Relevant lines are highlighted. The BufferAlloc function is responsible for seeking a free buffer. Once found, it will call LWLockAcquire which attempts to acquire the lock on the buffer. The remaining three functions (0, 1, and 2) suggest that the process is likely using a semaphore (in addition, some futex-related operations are also present) when it fails to acquire the lock.
What cannot be seen from here is whether the process sleeps or spins, and if it sleeps, then for how long. Tracing system calls can help us here. Their frequency and inputs can help us discern the nature of the waiting. Let’s strace it and see:
This is a portion of the trace. The futex syscall is not that frequently there. Moreover, on lines 15 and 16 there are two of them with different inputs. The one on line 15 makes the calling thread to sleep until awakened. This is because the fourth parameter, which determines the timeout of the sleep, is NULL. The next futex call wakes up a waiting thread. The third input is 1, indicating that only one thread must be awakened.
We now know how long a thread sleeps when it fails to acquire the lock — until it is woken up. Additionally, we have determined that there is either no or very little spinning.
We now peek at the source code. The call stack above shows that the LWLockAcquire is there in the lwlock.c file (irrelevant lines have been replaced with dots):
boolLWLockAcquire(LWLock *lock, LWLockMode mode){ ....................................................................for(;;){bool mustwait;/* * Try to grab the lock the first time, we're not in the waitqueue * yet/anymore.*/ mustwait =LWLockAttemptLock(lock, mode);if(!mustwait){LOG_LWDEBUG("LWLockAcquire", lock,"immediately acquired lock");break;/* got the lock */}/* add to the queue */LWLockQueueSelf(lock, mode);/* we're now guaranteed to be woken up if necessary */ mustwait =LWLockAttemptLock(lock, mode);/* ok, grabbed the lock the second time round, need to undo queueing */if(!mustwait){LOG_LWDEBUG("LWLockAcquire", lock,"acquired, undoing queue");LWLockDequeueSelf(lock);break;}/* * Wait until awakened. * * It is possible that we get awakened for a reason other than being * signaled by LWLockRelease. If so, loop back and wait again. Once * we've gotten the LWLock, re-increment the sema by the number of * additional signals received.*/LOG_LWDEBUG("LWLockAcquire", lock,"waiting");#ifdefLWLOCK_STATSlwstats->block_count++;#endifLWLockReportWaitStart(lock);if(TRACE_POSTGRESQL_LWLOCK_WAIT_START_ENABLED())TRACE_POSTGRESQL_LWLOCK_WAIT_START(T_NAME(lock), mode);for(;;){PGSemaphoreLock(proc->sem);if(!proc->lwWaiting)break; extraWaits++;}/* Retrying, allow LWLockRelease to release waiters again. */pg_atomic_fetch_or_u32(&lock->state, LW_FLAG_RELEASE_OK); ....................................................................LWLockReportWaitEnd();LOG_LWDEBUG("LWLockAcquire", lock,"awakened");/* Now loop back and try to acquire lock again. */ result =false;} ....................................................................return result;}
This is how it works. First, the process attempts to acquire the lock (line 13), and if unsuccessful, it queues itself up (line 21). The next attempt follows (line 24), and if successful, the process dequeues itself (line 31), allowing it to proceed when awakened. If it fails, it starts sleeping on a semaphore (line 55). Right before the sleep, the process registers a wait by calling LWLockReportWaitStart (line 49) and ends the wait by calling LWLockReportWaitEnd (line 64). The sleep ends when the process is awakened (line 57), and it retries to acquire the lock (line 62).
Therefore, the process of LWLock acquisition is more about sleeping than spinning. The duration of the wait is the time a process sleeps on a semaphore, excluding external waits. Just a few spins are negligible in comparison to this.
It all started with a performance issue in one of our clusters. One of the components on the critical path turned out to be the OSscheduler which I analyzed to find out whether it was the offender itself or just a symptom, and the global slowness was caused by other factors in the stack. The whole story is very long and would take (I guess) several pages or so to describe everything. That is why I will just present here a short exert which is a part of the whole diagnosis journey. So, don’t be surprised to notice that the story does not (sort of) have neither the beginning nor the end.
I decided to peek at the OS scheduler as vmstat reported high run queue lengths. This led me to conclude that the former will highly likely bring me to the ultimate offender. The scheduler statistics can be traced with the perf command which has many options. Since the issue was ongoing for several minutes, few tens of seconds would suffice. Moreover, as I didn’t know which scheduler event should be focused upon, I traced all of them:
[fgenceliyev@machine1 ~]$ sudo perf sched record -- sleep 10
[ perf record: Woken up 1 times to write data ]
[ perf record: Captured and wrote 50.183 MB perf.data (132,856 samples) ]
The next step was to check whether what I suspected was true and I was going in the right direction (the output is intentionally shortened):
[fgenceliyev@machine1 ~]$ sudo perf sched latency --sort max

 -----------------------------------------------------------------------------------------------------------------
  Task                  |   Runtime ms  | Switches | Average delay ms | Maximum delay ms | Maximum delay at       |
 -----------------------------------------------------------------------------------------------------------------
  MutationStage-1:(2)   |    240.607 ms |    13933 | avg:    0.083 ms | max:  416.618 ms | max at: 275770.668504 s
  C2 CompilerThre:(6)   |   9980.936 ms |     2010 | avg:    0.934 ms | max:  322.393 ms | max at: 275772.038103 s
  MutationStage-8:17873 |     50.710 ms |     1743 | avg:    0.248 ms | max:  310.998 ms | max at: 275771.587630 s
  MutationStage-5:17870 |     62.694 ms |     2213 | avg:    0.347 ms | max:  310.980 ms | max at: 275771.587612 s
  Thread-17:19000       |     49.637 ms |      783 | avg:    0.494 ms | max:  310.795 ms | max at: 275771.587998 s
  vmtoolsd:1972         |     17.737 ms |       73 | avg:    4.401 ms | max:  287.086 ms | max at: 275769.602360 s
  ................................................................................................................
  ................................................................................................................
  ................................................................................................................
No comments here: huge delays ! The are two good news here though: a) the output has a timestamp that shows when the maximum delay happened for a particular process (or thread) and b) it doesn’t matter which process from the output we now chase to drill down further since (whatever it is) all of them suffer from the same.
At this point, we know the delay is there but we don’t know where that delay occurs. In other words, we now need to split the delay into its parts and see where exactly time is spent most (we can take an arbitrary process to measure).
Let’s take the very first timestamp (275770.668504) for analysis and see how time is distributed. This can be achieved by using timehist option of perf which gives a breakdown of the events.
We are interested in two columns: wait time and sch delay. The first is the time a task was waiting to be woken up and the second is the time from the moment the context switch begins up to the point a task is scheduled in. The latter is the scheduler latency i.e. time it takes the scheduler to change the task’s status to Runnable so that it can then be switched to Running.
What we can see (line 16) is that the scheduler latency is very high: 0.277msecs but what’s even worse is that the task has been waiting for 416msecs just to be picked up by the scheduler. Such a situation is a little tricky as it resembles the ‘chicken and egg problem’ since either can cause the other one: the scheduler’s slow decision could be because of the same reasons that the task had to wait long and, conversely, high scheduler latencies can cause significant delays before a task receives a wake-up signal. Without any evidence we cannot judge neither to be the cause. If we don’t have enough evidence (and sometimes we don’t :)) ) we should be able to draw conclusions like what is more and what is less likely.
Since we don’t know which caused the other one we should attack each of them separately as if we don’t have the other issue at all. Thus, the first question is “What affects latency of scheduler decisions?”
Recall that the OS scheduler is just another kernel thread and to do its job it needs CPU time. If the CPU is saturated (for example, by doing heavy I/O or doing moderate I/O from a slow device) then the scheduler’s behavior can be affected and, hence, its latency may rise.
This is a three-node Apache Cassandra cluster. For each type of tasks (such as handling client requests, updating the tables and etc.) the database maintains a pool of threads each of which performs its job. We need to see what those threads are doing and, apparently, that will tell us the actions that burn the CPU (or which are slow). To see the breakdown by threads we will use the psn (Tanel Poder’s process snapper)
The comm2 column shows a thread from the thread pool and the state column shows what that thread was doing at the time of sampling. What is clear (line 5–9) is that a number of threads is “ON CPU” but what also catches eye is that quite a portion of them are waiting for disk I/O to complete (Disk (Uninterruptible) state). Here I’m showing just one sample and not going into details of the values in wchain and kstack columns. Sampling the threads several times shows the same behavior. For a database like Cassandra (if configured properly) we should not observe many threads spending their time on I/O.
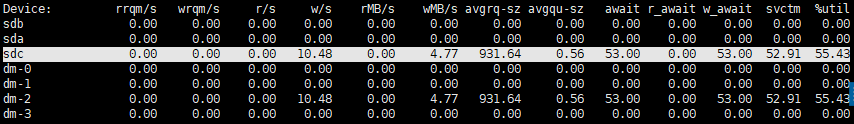
This leads us to suspect that the storage subsystem is not catching up. The iostat output is to the rescue (for the following two outputs I got only screens saved aside):
It takes 53 msecs to write 4.77 MB of data! Plus, avgqu-sz is low, thus, there is no queueing up. The next contact is the storage team.
Let’s also see bcc-tools output just for diversity. The last column is latency in milliseconds and the third column from the end is the amount of data (in bytes) written: 512 KB gets written in 0.4 secs !
The whole investigation journey could have been much shorter should we simply had run iostat and analyze the I/O latency. But that would be just a ‘matter of luck’. Even if the path is long, if you take the right direction from the very beginning it will definitely take you to the cause.
Here are some six ways that can be used to force a query go with sequential scan access method in PostgresSQL. The objective is to eliminate any index access in the query. The test table looks as follows.
postgres=# create table tablescandemo as select generate_series(1,100000) id;
SELECT 100000
postgres=# create index ind1demo on testtable1(id);
CREATE INDEX
Let’s get started.
Option I. Using enable_indexscan, enable_indexonlyscan and enable_bitmapscan parameters. The enable_indexscan parameter disables index access path. Let’s try it out.
postgres=# set enable_indexscan = off;
SET
postgres=# explain analyze select * from tablescandemo where id = 100;
                                                     QUERY PLAN
--------------------------------------------------------------------------------------------------------------------
 Bitmap Heap Scan on tablescandemo  (cost=12.17..482.50 rows=500 width=4) (actual time=0.039..0.041 rows=1 loops=1)
   Recheck Cond: (id = 100)
   Heap Blocks: exact=1
   ->  Bitmap Index Scan on inddemo  (cost=0.00..12.04 rows=500 width=0) (actual time=0.026..0.027 rows=1 loops=1)
         Index Cond: (id = 100)
 Planning Time: 0.568 ms
 Execution Time: 0.091 ms
(7 rows)
The planner still accesses the index but this time it is behaving differently. The index is accessed in the same way as in index scan method, however, as a result, the database doesn’t build a set of rowids of the heap rows but a bitmap: one bit per heap page. This is how the bitmap index scan works. The table is sequentially scanned and the bitmap is used to decide whether a particular page must be probed or not. The enable_bitmapscan parameter controls bitmap index scan access method:
postgres=# set enable_bitmapscan = off;
SET
postgres=# explain analyze select * from tablescandemo where id = 100;
                                                         QUERY PLAN
----------------------------------------------------------------------------------------------------------------------------
 Index Only Scan using inddemo on tablescandemo  (cost=0.29..4.31 rows=1 width=4) (actual time=0.070..0.071 rows=1 loops=1)
   Index Cond: (id = 100)
   Heap Fetches: 0
 Planning Time: 0.086 ms
 Execution Time: 0.094 ms
(5 rows)
Now, index only scan scan kicks in since the table has a single column which is indexed. Let’s turn it off as well:
postgres=# set enable_indexonlyscan = off;
SET
postgres=# explain analyze select * from tablescandemo where id = 100;
                                                QUERY PLAN
----------------------------------------------------------------------------------------------------------
 Seq Scan on tablescandemo  (cost=0.00..1693.00 rows=1 width=4) (actual time=0.021..9.114 rows=1 loops=1)
   Filter: (id = 100)
   Rows Removed by Filter: 99999
 Planning Time: 0.065 ms
 Execution Time: 9.137 ms
(5 rows)
Basically, once needs to make sure that not just one but all index access methods (index scan, index only scan and bitmap index scan) are off.
Option II. Using random_page_cost parameter. This parameter tells the optimizer the cost of a randomly accessed disk page. This concerns both index and table pages. Therefore, the higher this value, the more it should cost the optimizer to use index access path, especially, if the index is not very selective. Let’s see the experiment results (index scan, index only scan and bitmap index scan control parameter values are all on now):
postgres=# set random_page_cost = 100000;
SET
postgres=# explain analyze select * from tablescandemo where id = 100;
                                                QUERY PLAN
-----------------------------------------------------------------------------------------------------------
 Seq Scan on tablescandemo  (cost=0.00..1693.00 rows=1 width=4) (actual time=0.034..10.175 rows=1 loops=1)
   Filter: (id = 100)
   Rows Removed by Filter: 99999
 Planning Time: 0.071 ms
 Execution Time: 10.200 ms
(5 rows)
The optimizer estimates that retrieving tuple(s) via the index will be higher than sequential scan and, hence, prefers solely the latter.
OptionIII. Altering table statistics. At the end of the day, optimizer uses database statistics which one can actually fake. Selectivity of the predicate is the primary factor in deciding which access path to take. It is based on the cardinality which itself calculated as the number of tuples that qualify the predicate. The latter is (assuming no extended statistics exist) nothing but N/NDV where N is the number of tuples in the table and NDV is the number of distinct values of the column. The higher the NDV, the more selective the predicate is, and, thus, the higher the probability that the optimizer leans towards index access rather than sequential scan. Therefore, if NDV is low, the optimizer will think that most of the table tuples qualify: that is, index access will cost much more than sequential scan, thus, preferring the latter. Let’s check it out.
postgres=# alter table tablescandemo alter column id set (n_distinct = 1);
ALTER TABLE
postgres=# analyze tablescandemo;
ANALYZE
postgres=# explain analyze select * from tablescandemo where id = 100;
                                                  QUERY PLAN
---------------------------------------------------------------------------------------------------------------
 Seq Scan on tablescandemo  (cost=0.00..1693.00 rows=100000 width=4) (actual time=0.015..6.366 rows=1 loops=1)
   Filter: (id = 100)
   Rows Removed by Filter: 99999
 Planning Time: 0.098 ms
 Execution Time: 6.379 ms
(5 rows)
OptionIV. ‘Hacking’ table statistics. Even though the previous option is a valid one, it has two drawbacks: 1) alter table command will lock the table in exclusive mode and 2) analyze table may take considerable amount of time depending on the size of the table. So, if that is the case, then you can update statistics directly in the pg_statistic table. Surely, this is not an accurate way but still works and in extreme cases may come in handy:
postgres=# update pg_statistic set stadistinct = 1 where starelid = (select oid from pg_class where relname = 'tablescandemo');;
UPDATE 1
postgres=# explain analyze select * from tablescandemo where id = 6;
                                             QUERY PLAN
-----------------------------------------------------------------------------------------------------
 Seq Scan on tablescandemo(cost=0.00..1693.00 rows=100000 width=4) (actual time=0.008..6.612 rows=1 loops=1)
   Filter: (id = 6)
   Rows Removed by Filter: 99999
 Planning Time: 0.115 ms
 Execution Time: 6.625 ms
(5 rows)

postgres=#
OptionV. ‘Hacking’ table statistics (Part II). Another statistics you can fake is number of pages a table contains. The lesser it is, the higher the probability that sequential scan will kick in. This information is kept in pg_class table and can be manipulated just like any other column value:
postgres=# update pg_class set reltuples=1 where relname = 'tablescandemo';
UPDATE 1
postgres=# explain analyze select * from tablescandemo where id = 6;
                                          QUERY PLAN
-----------------------------------------------------------------------------------------------
 Seq Scan on tablescandemo(cost=0.00..443.01 rows=1 width=4) (actual time=0.010..6.496 rows=1 loops=1)
   Filter: (id = 6)
   Rows Removed by Filter: 99999
 Planning Time: 0.138 ms
 Execution Time: 6.511 ms
(5 rows)
postgres=#
OptionVI. Using hints. PostgreSQL does not support hints out-of-the-box. However, you can use pg_hint_plan to hint queries. It provides hints for scan methods, join methods, join order, parallelism, row number correction and few others.
Here is a quick and interesting observation regarding the %logons% statistics. The database version is Oracle 19c and, apparently, it applies to earlier versions as well. The question that I am trying to answer here is this “How does a parallel query execution relate to %logon% statistics?”
Here is a test case.
Let’s check the statistics for the instance:
SQL> select name, value from v$sysstat where name like '%logon%';

NAME					          VALUE
-------------------------------- ----------
logons cumulative				  68368
logons current				      108
user logons cumulative            6762

SQL>
Now, do nothing but log on to the database:
Connected to:
Oracle Database 19c Enterprise Edition Release 19.0.0.0.0 - Production
Version 19.3.0.0.0

SQL>
Let’s check the statistics again:
SQL> select name, value from v$sysstat where name like '%logon%';

NAME					          VALUE
-------------------------------- ----------
logons cumulative				  68369
logons current				      109
user logons cumulative            6763

SQL>
As a result, each of the statistics above gets incremented by one. So far, so good.
Now, from within that brand-new session, let’s execute a parallel query:
SQL> select name, value from v$sysstat where name like '%logon%';

NAME					          VALUE
-------------------------------- ----------
logons cumulative				  68377
logons current				      109
user logons cumulative            6763

SQL>
As a result, the only statistics that changes is “logons cumulative“. It has grown by exactly the number of allocated parallel slaves: 8. Repetitive execution of the same query with different degrees of parallelism increments only this statistics and it does this by that degree each time.
The “logons current” statistics doesn’t change. This one doesn’t include the slave sessions but the coordinator only. The coordinator sid is the actually the sid of the session that executes the query. Another observation is that “user logons cumulative” statistics does not include slave processes either.
This may come in very handy when troubleshooting a logon storm caused by parallel execution.
The quickest and simplest way of ensuring what has been populated in In-Memory column store (IMCS) is to query the V$IM_SEGMENTS view. Whenever an object is loaded into IMCS, the database will add a record about it into this view. In general, I guess the appearance of the IMCS as such is an attempt of Oracle to transition to NewSQL stack.
According to Oracle documentation the IMCS can be enabled for a tablespace, table (including external and excluding IOT), table partition and materialized view (MV). What is more interesting is that it also mentions when, for example, a table gets populated in IMCS – only when it is fully scanned (and not parallelly). Index access methods that cover table tuples and table tuples populated by rowids never load the tuples in IMCS.
Documentation does not say a word about when a MV gets populated in IMCS. It would be reasonable to assume that since a MV is very much like a heap table, then the table IMCS population rules apply to the former as well i.e. for a MV to get populated in IMCS an explicit nonparallel full scan of it is necessary. This is indeed so. Additionally, implicit population of MV is also possible and this with a little trick only. The table access which causes query rewrite (fully accessing the MV) can also trigger it. All this said, this post is not about something advanced but rather an interesting take-away about IMCS.
The test case is on Oracle 12C. First, let’s create a non-empty table and define a MV on it:
SQL> create table testtable1 as select object_id, object_name from dba_objects;

Table created.

SQL> create materialized view testview1 enable query rewrite as select * from testtable1;

Materialized view created.

SQL>
Let’s now enable IMCS for the view and confirm that the it really gets populated in there when scanned fully:
SQL> alter materialized view testview1 inmemory;

Materialized view altered.

SQL> select count(*) from testview1;

  COUNT(*)
----------
     73306

SQL> select segment_name, populate_status from v$im_segments;

SEGMENT_NAME                        POPULATE_STATUS
----------------------------------- -------------
TESTVIEW1			                 COMPLETED
Now, let’s flush the MV from IMCS but make it eligible for population again. Also, let’s query the table so that the query rewritekicks in:
SQL> alter materialized view testview1 no inmemory;

Materialized view altered.

SQL> alter materialized view testview1 inmemory;

SQL> select segment_name, populate_status from v$im_segments;

no rows selected.

SQL>
As the result from v$im_segments shows, the MV is not there…yet. Let’s cause a full scan of the MV again:
SQL> select count(*) from testview1;

  COUNT(*)
----------
     73306

SQL> select segment_name, populate_status from v$im_segments;

no rows selected.

SQL>
Subsequent executions of the same query still doesn’t make the MV appear in IMCS, although the little trick will make it to get populated:
SQL> alter table testtable1 inmemory;

Table altered.

SQL> select count(*) from testtable1;

  COUNT(*)
----------
     73305

SQL> select segment_name, populate_status from v$im_segments;

SEGMENT_NAME	                POPULATE_STATUS
------------------------------ -------------
TESTVIEW1		                COMPLETED

SQL>
The next time the query will execute the table data will be retrieved from the MV which is now in IMCS (the reason for going parallel is described in the note 2373556.1 which is a bug and has a workaround). The query rewrite can cause MV population in IMCS and for that to happen the base table must have the INMEMORY option enabled.
That’s all for this time. More advanced stuff is coming soon…
The following is a (short and quick) scenario I recently faced when analyzing a parallel query and its response time. This may not apply to earlier versions of Oracle though. The experiments were carried out in 19c.
The ‘weird’ behavior I observed was that V$SQL.EXECUTIONS column didn’t get updated for the query under analysis when executed. The first gotcha is, perhaps, “That must be a bug“. Let’s be more systematic however, and arrive at the root cause gradually.
Here is a test case. First, I am simply executing the query three times and checking the v$sql.
SQL> select sql_id, sql_text, executions, child_number from v$sql where sql_text like '%test1%';

SQL_ID	      SQL_TEXT                              EXECUTIONS CHILD_NUMBER
------------- ---------------------------------     ---------- ------------
4gy00kap2kf3n	select /*+ test1 */ * from table1   3	        0
4gy00kap2kf3n	select /*+ test1 */ * from table1   0	        1

2 rows selected.

SQL>
The output shows that the database decided to generate another child (CHILD_NUMBER=1) for this statement. However, the primary question here is “Why are there NO executions for the second child?“.
The reason for not sharing that can be found from v$sql_shared_cursor is not of interest, although it may shed some light on the question. Still, let’s take a different strategy without consulting this view.
Two approaches can be taken to move forward with this ‘issue’: a) Try A, try B, try C,… and hope it helps to find out the reason, and perhaps, eventually one of them will and b) Ask the right questions. Before blaming the database for bugs, lets put it aside as the last resort. There must be something about this that at this point not known yet and that may lead to the clue.
The simplest question one can ask here can be something like “Would there by any other statistics that applies to child cursors which has probably been missed out?” This is a separate child and, thus, the entry point should be v$sql. Scanning the column names of the view for ‘%EXEC’% reveals another field: PX_SERVERS_EXECUTIONS. Let’s query this column as well:
SQL> select sql_id, sql_text, executions, px_servers_executions, child_number from v$sql where sql_text like '%test1%';

SQL_ID	      SQL_TEXT						      EXECUTIONS PX_SERVERS_EXECUTIONS CHILD_NUMBER
------------- ---------------------------------- ---------- --------------------- ------------

4gy00kap2kf3n select /*+ test1 */ * from table1  3			 0	                   0
4gy00kap2kf3n select /*+ test1 */ * from table1  0			 12	                   1

2 rows selected.

SQL>
PX_SERVERS_EXECUTIONS holds the total number of executions by the slaves of a parallel query. This explains why the second cursor executions are not reflected in V$SQL.EXECUTIONS column. For parallel slaves Oracle tracks it in a different column: V$SQL.PX_SERVERS_EXECUTIONS and in this case it has been executed 12 times so far. Since the query does have any parallelism forced by the hint, hence the table-level parallelism must set which is confirmed by dba_tables.degree being equal to 4. The one with CHILD_NUMBER=0 is actually the coordinator. The query executes in parallel:
SQL> select * from dbms_xplan.display_cursor('4gy00kap2kf3n', 0, 'ALLSTATS ALL');

SQL_ID	4gy00kap2kf3n, child number 0
-------------------------------------
select /*+ test1 */ * from table1

Plan hash value: 1574891232

--------------------------------------------------------------------------------------------------------------
| Id  | Operation            | Name     | Rows  | Bytes | Cost (%CPU)| Time     |    TQ  |IN-OUT| PQ Distrib |
--------------------------------------------------------------------------------------------------------------
|   0 | SELECT STATEMENT     |          | 73216 |  9438K|   110   (0)| 00:00:01 |        |      |            |
|   1 |  PX COORDINATOR      |          |       |       |            |          |        |      |            |
|   2 |   PX SEND QC (RANDOM)| :TQ10000 | 73216 |  9438K|   110   (0)| 00:00:01 |  Q1,00 | P->S | QC (RAND)  |
|   3 |    PX BLOCK ITERATOR |          | 73216 |  9438K|   110   (0)| 00:00:01 |  Q1,00 | PCWC |            |
|   4 |     TABLE ACCESS FULL| TABLE1   | 73216 |  9438K|   110   (0)| 00:00:01 |  Q1,00 | PCWP |            |
--------------------------------------------------------------------------------------------------------------

Hint Report (identified by operation id / Query Block Name / Object Alias):
Total hints for statement: 1 (E - Syntax error (1))
---------------------------------------------------------------------------
   1 -  SEL$1
   E -  test1
Note
-----
   - Degree of Parallelism is 4 because of table property

28 rows selected.

SQL>
Morale: Step-by-step approach is the key regardless of the issue and the DBMS.
I will not pretend that the idea presented in this post is aimed at addressing a number of troubleshooting scenarios but in some cases it may come in handy. For example, imagine a situation such that you cannot log in to the database because of a long-running query which makes it unresponsive. However, the OS is running fine and can be worked with.
The simple and not-yet-so-mature approach presented here should help one judge about the potential join method that a query is performing. At least, it may give certain (though incomplete) ground to reason about it.
Given all other conditions are same, the Nested Loop join method is the one that will execute the highest number of iterations to fetch the requested tuples. The other two methods, Hash Join and Sort-Merge Join will face less number of iterations and, perhaps, less number of loops.
The scenario with the assumptions above is not a rare. However, the question can be “Once you start suspecting that it is most probably the Nested Loop join that’s causing the hang, how can it help?”. At least, one can tell the software developers to fix the query by changing the join method which should solve the issue. Since (as assumed) the database is unresponsive, one cannot peek at the explain plan and tell for sure. What can help though is “expressing the join method via loops”.
To do this, let’s step aside a little.
When the compiler converts a loop in high-level code (while/for) to assembly, it maps it to a Branch instruction. The branch instruction updates the contents of the Program Counter (PC; also known as Extended Instruction Pointer in x86) register by the address stored in the Branch Target Address (BTA). On the next cycle the CPU fetches the instruction from the PC (which is the address of the instruction pointed to by the branch instruction) and executes it. To illustrate it, here is an assembly example for ARM processors:
.global main

main:
        mov     r0, #0     /* setting up initial variable a */
loop:   cmp     r0, #4     /* checking if a==4 */
        beq     end        /* proceeding to the end if a==4 */
        add     r0, r0, #1 /* increasing a by 1 if the jump to the end did not occur */
        b loop             /* repeating the loop */
end:
        bx lr              /* THE END */
Here, b is a branch instruction with the label loop. The label loop points to the instruction cmp (compare). When the CPU reaches the b loop (line 8) instruction, the PC’s contents are updated by the value stored in the loop label which is nothing but the address of the cmp instruction. On the next cycle when the PC is fetched, the address of the cmp (line 5) is returned and the instruction is fetched by its address and executed. In this way, the branch instruction “makes a jump”. This is how a loop iterates over.
Thus, a high number of branch instructions can be an indicator of an excessive execution of iterations, in particular, a Nested Loop join.
The next step is finding some OS statistics that shows the number of branch instructions executing in real time. This is where the perf tool comes into play.
The perf tool is a performance profiler that can display various hardware and software statistics and counters. It can also be attached to a running process. For example, as follows:
The command populates statistics until cancelled (CTRL+C). So, the perf command shows that by that time 1,488,797,176 branch instructions were executed out of which 53,395,139 the branch predictor failed to predict. The former is actually is the main metric that is of interest. If a high number of deltas is observed with the branches metric, then this indicates that the code is executing high number of iterations. This in turn, can direct us to suspect that (probably) a Nested Loop join method is running intensively. Peeking at this metric sampled over time and seeing that this number is unreasonably high can give a tip that the code needs to be checked for a loop that is iterating over and over again.
Side note: The Nested Loop join is not the only code path that can cause this. This can also be, for example, due to latch contention since a retrylogic is an essential part of pretty much any latch implementation. Another example can be index scan: when the code iteratively walks through the index to find the key which (by the way) can be a part of the Nested Loop join. The approach presented should be applicable to any RDBMS.
In the next post, I will reproduce a highly iterative Nested Loop join and will analyze the metric mentioned. This will give a better insight into improving the idea briefly presented.