It all started with a performance issue in one of our clusters. One of the components on the critical path turned out to be the OS scheduler which I analyzed to find out whether it was the offender itself or just a symptom, and the global slowness was caused by other factors in the stack. The whole story is very long and would take (I guess) several pages or so to describe everything. That is why I will just present here a short exert which is a part of the whole diagnosis journey. So, don’t be surprised to notice that the story does not (sort of) have neither the beginning nor the end.
I decided to peek at the OS scheduler as vmstat reported high run queue lengths. This led me to conclude that the former will highly likely bring me to the ultimate offender. The scheduler statistics can be traced with the perf command which has many options. Since the issue was ongoing for several minutes, few tens of seconds would suffice. Moreover, as I didn’t know which scheduler event should be focused upon, I traced all of them:
[fgenceliyev@machine1 ~]$ sudo perf sched record -- sleep 10
[ perf record: Woken up 1 times to write data ]
[ perf record: Captured and wrote 50.183 MB perf.data (132,856 samples) ]
The next step was to check whether what I suspected was true and I was going in the right direction (the output is intentionally shortened):
[fgenceliyev@machine1 ~]$ sudo perf sched latency --sort max

 -----------------------------------------------------------------------------------------------------------------
  Task                  |   Runtime ms  | Switches | Average delay ms | Maximum delay ms | Maximum delay at       |
 -----------------------------------------------------------------------------------------------------------------
  MutationStage-1:(2)   |    240.607 ms |    13933 | avg:    0.083 ms | max:  416.618 ms | max at: 275770.668504 s
  C2 CompilerThre:(6)   |   9980.936 ms |     2010 | avg:    0.934 ms | max:  322.393 ms | max at: 275772.038103 s
  MutationStage-8:17873 |     50.710 ms |     1743 | avg:    0.248 ms | max:  310.998 ms | max at: 275771.587630 s
  MutationStage-5:17870 |     62.694 ms |     2213 | avg:    0.347 ms | max:  310.980 ms | max at: 275771.587612 s
  Thread-17:19000       |     49.637 ms |      783 | avg:    0.494 ms | max:  310.795 ms | max at: 275771.587998 s
  vmtoolsd:1972         |     17.737 ms |       73 | avg:    4.401 ms | max:  287.086 ms | max at: 275769.602360 s
  ................................................................................................................
  ................................................................................................................
  ................................................................................................................
No comments here: huge delays ! The are two good news here though: a) the output has a timestamp that shows when the maximum delay happened for a particular process (or thread) and b) it doesn’t matter which process from the output we now chase to drill down further since (whatever it is) all of them suffer from the same.
At this point, we know the delay is there but we don’t know where that delay occurs. In other words, we now need to split the delay into its parts and see where exactly time is spent most (we can take an arbitrary process to measure).
Let’s take the very first timestamp (275770.668504) for analysis and see how time is distributed. This can be achieved by using timehist option of perf which gives a breakdown of the events.
[fgenceliyev@machine1 ~]$ sudo perf sched timehist -f
           time    cpu  task name                       wait time  sch delay   run time
                        [tid/pid]                          (msec)     (msec)     (msec)
--------------- ------  ------------------------------  ---------  ---------  ---------
  275767.383658 [0001]  cluster1-nio-wo[18972/18944]        0.000      0.000      0.000
  275767.383663 [0002]  <idle>                              0.000      0.000      0.000
  275767.383664 [0000]  <idle>                              0.000      0.000      0.000
  275767.383670 [0002]  MutationStage-5[17870/17693]        0.000      0.000      0.006
  275767.383670 [0000]  MutationStage-1[17803/17693]        0.000      0.000      0.006
  275767.383696 [0003]  cluster1-nio-wo[18970/18944]        0.000      0.000      0.000
  275767.383697 [0001]  Thread-6[18989/18944]               0.000      0.000      0.039
  275767.383699 [0005]  <idle>                              0.000      0.000      0.000
  .....................................................................................
  .....................................................................................
  .....................................................................................
  275770.668504 [0004]  cluster1-nio-wo[18971/18944]      416.371      0.277      0.254
  .....................................................................................
  .....................................................................................
  .....................................................................................
We are interested in two columns: wait time and sch delay. The first is the time a task was waiting to be woken up and the second is the time from the moment the context switch begins up to the point a task is scheduled in. The latter is the scheduler latency i.e. time it takes the scheduler to change the task’s status to Runnable so that it can then be switched to Running.
What we can see (line 16) is that the scheduler latency is very high: 0.277 msecs but what’s even worse is that the task has been waiting for 416 msecs just to be picked up by the scheduler. Such a situation is a little tricky as it resembles the ‘chicken and egg problem’ since either can cause the other one: the scheduler’s slow decision could be because of the same reasons that the task had to wait long and, conversely, high scheduler latencies can cause significant delays before a task receives a wake-up signal. Without any evidence we cannot judge neither to be the cause. If we don’t have enough evidence (and sometimes we don’t :)) ) we should be able to draw conclusions like what is more and what is less likely.
Since we don’t know which caused the other one we should attack each of them separately as if we don’t have the other issue at all. Thus, the first question is “What affects latency of scheduler decisions?”
Recall that the OS scheduler is just another kernel thread and to do its job it needs CPU time. If the CPU is saturated (for example, by doing heavy I/O or doing moderate I/O from a slow device) then the scheduler’s behavior can be affected and, hence, its latency may rise.
This is a three-node Apache Cassandra cluster. For each type of tasks (such as handling client requests, updating the tables and etc.) the database maintains a pool of threads each of which performs its job. We need to see what those threads are doing and, apparently, that will tell us the actions that burn the CPU (or which are slow). To see the breakdown by threads we will use the psn (Tanel Poder’s process snapper)
=== Active Threads =============================================================================================================================================================================================================================================================================================================================================================================================================================================================================================================

 samples | avg_threads | comm2             | state                  | wchan                        | kstack
--------------------------------------------------------------------------------------------------------------------------------------------------------------------------------------------------------------------------------------------------------------------------------------------------------------------------------------------------------------------------------------------------------------------------------------------------------------------------------------------------------------------------------
      32 |        4.00 | (Native-Transpor) | Running (ON CPU)       | 0                            | system_call_fastpath()->SyS_futex()->do_futex()->futex_wait()->futex_wait_queue_me()
      20 |        2.50 | (MutationStage-1) | Disk (Uninterruptible) | wait_on_page_bit_killable    | page_fault()->do_page_fault()->__do_page_fault()->handle_mm_fault()->handle_pte_fault()->do_shared_fault.isra.64()->__do_fault.isra.61()->xfs_filemap_fault()->__xfs_filemap_fault()->filemap_fault()->__lock_page_or_retry()->wait_on_page_bit_killable()
      19 |        2.38 | (Native-Transpor) | Running (ON CPU)       | futex_wait_queue_me          | system_call_fastpath()->SyS_futex()->do_futex()->futex_wait()->futex_wait_queue_me()
      18 |        2.25 | (Native-Transpor) | Disk (Uninterruptible) | wait_on_page_bit_killable    | page_fault()->do_page_fault()->__do_page_fault()->handle_mm_fault()->handle_pte_fault()->do_shared_fault.isra.64()->__do_fault.isra.61()->xfs_filemap_fault()->__xfs_filemap_fault()->filemap_fault()->__lock_page_or_retry()->wait_on_page_bit_killable()
      16 |        2.00 | (java)            | Running (ON CPU)       | 0                            | -
       8 |        1.00 | (MutationStage-1) | Disk (Uninterruptible) | call_rwsem_down_write_failed | page_fault()->do_page_fault()->__do_page_fault()->handle_mm_fault()->handle_pte_fault()->do_shared_fault.isra.64()->do_page_mkwrite()->xfs_filemap_page_mkwrite()->__xfs_filemap_fault()->file_update_time()->update_time()->xfs_vn_update_time()->xfs_ilock()->call_rwsem_down_write_failed()
       7 |        0.88 | (Native-Transpor) | Disk (Uninterruptible) | call_rwsem_down_write_failed | page_fault()->do_page_fault()->__do_page_fault()->handle_mm_fault()->handle_pte_fault()->do_shared_fault.isra.64()->do_page_mkwrite()->xfs_filemap_page_mkwrite()->__xfs_filemap_fault()->file_update_time()->update_time()->xfs_vn_update_time()->xfs_ilock()->call_rwsem_down_write_failed()
       6 |        0.75 | (Native-Transpor) | Running (ON CPU)       | 0                            | do_futex()->futex_wait()->hrtimer_cancel()->hrtimer_try_to_cancel()
       5 |        0.62 | (MutationStage-6) | Disk (Uninterruptible) | wait_on_page_bit_killable    | page_fault()->do_page_fault()->__do_page_fault()->handle_mm_fault()->handle_pte_fault()->do_shared_fault.isra.64()->__do_fault.isra.61()->xfs_filemap_fault()->__xfs_filemap_fault()->filemap_fault()->__lock_page_or_retry()->wait_on_page_bit_killable()
       5 |        0.62 | (epollEventLoopG) | Running (ON CPU)       | 0                            | -
       4 |        0.50 | (MutationStage-9) | Disk (Uninterruptible) | wait_on_page_bit_killable    | page_fault()->do_page_fault()->__do_page_fault()->handle_mm_fault()->handle_pte_fault()->do_shared_fault.isra.64()->__do_fault.isra.61()->xfs_filemap_fault()->__xfs_filemap_fault()->filemap_fault()->__lock_page_or_retry()->wait_on_page_bit_killable()
       4 |        0.50 | (Native-Transpor) | Running (ON CPU)       | 0                            | -
       4 |        0.50 | (java)            | Running (ON CPU)       | 0                            | do_futex()->futex_wait()->futex_wait_queue_me()
       3 |        0.38 | (MutationStage-1) | Running (ON CPU)       | 0                            | system_call_fastpath()->SyS_futex()->do_futex()->futex_wait()->futex_wait_queue_me()
       3 |        0.38 | (Native-Transpor) | Disk (Uninterruptible) | __lock_page                  | page_fault()->do_page_fault()->__do_page_fault()->handle_mm_fault()->handle_pte_fault()->do_shared_fault.isra.64()->do_page_mkwrite()->xfs_filemap_page_mkwrite()->__xfs_filemap_fault()->iomap_page_mkwrite()->__lock_page()
       2 |        0.25 | (MutationStage-1) | Disk (Uninterruptible) | __lock_page                  | page_fault()->do_page_fault()->__do_page_fault()->handle_mm_fault()->handle_pte_fault()->do_shared_fault.isra.64()->do_page_mkwrite()->xfs_filemap_page_mkwrite()->__xfs_filemap_fault()->iomap_page_mkwrite()->__lock_page()
       2 |        0.25 | (MutationStage-2) | Running (ON CPU)       | futex_wait_queue_me          | system_call_fastpath()->SyS_futex()->do_futex()->futex_wait()->futex_wait_queue_me()
       2 |        0.25 | (MutationStage-7) | Disk (Uninterruptible) | call_rwsem_down_write_failed | page_fault()->do_page_fault()->__do_page_fault()->handle_mm_fault()->handle_pte_fault()->do_shared_fault.isra.64()->do_page_mkwrite()->xfs_filemap_page_mkwrite()->__xfs_filemap_fault()->file_update_time()->update_time()->xfs_vn_update_time()->xfs_ilock()->call_rwsem_down_write_failed()
       2 |        0.25 | (MutationStage-8) | Disk (Uninterruptible) | wait_on_page_bit_killable    | page_fault()->do_page_fault()->__do_page_fault()->handle_mm_fault()->handle_pte_fault()->do_shared_fault.isra.64()->__do_fault.isra.61()->xfs_filemap_fault()->__xfs_filemap_fault()->filemap_fault()->__lock_page_or_retry()->wait_on_page_bit_killable()
       2 |        0.25 | (Native-Transpor) | Running (ON CPU)       | 0                            | page_fault()->do_page_fault()->__do_page_fault()->handle_mm_fault()->handle_pte_fault()->do_shared_fault.isra.64()->__do_fault.isra.61()->xfs_filemap_fault()->__xfs_filemap_fault()->filemap_fault()->__lock_page_or_retry()->wait_on_page_bit_killable()
       2 |        0.25 | (Native-Transpor) | Running (ON CPU)       | 0                            | page_fault()->do_page_fault()->__do_page_fault()->handle_mm_fault()->handle_pte_fault()->do_shared_fault.isra.64()->do_page_mkwrite()->xfs_filemap_page_mkwrite()->__xfs_filemap_fault()->iomap_page_mkwrite()->__lock_page()
       1 |        0.12 | (MessagingServic) | Running (ON CPU)       | 0                            | -
  ................................................................................................................
  ................................................................................................................
  ................................................................................................................
The comm2 column shows a thread from the thread pool and the state column shows what that thread was doing at the time of sampling. What is clear (line 5–9) is that a number of threads is “ON CPU” but what also catches eye is that quite a portion of them are waiting for disk I/O to complete (Disk (Uninterruptible) state). Here I’m showing just one sample and not going into details of the values in wchain and kstack columns. Sampling the threads several times shows the same behavior. For a database like Cassandra (if configured properly) we should not observe many threads spending their time on I/O.
This leads us to suspect that the storage subsystem is not catching up. The iostat output is to the rescue (for the following two outputs I got only screens saved aside):
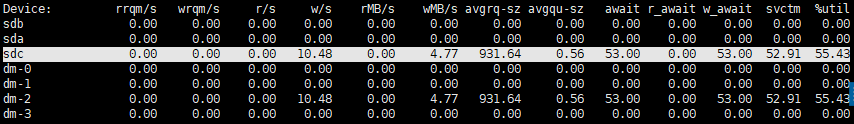
It takes 53 msecs to write 4.77 MB of data! Plus, avgqu-sz is low, thus, there is no queueing up. The next contact is the storage team.
Let’s also see bcc-tools output just for diversity. The last column is latency in milliseconds and the third column from the end is the amount of data (in bytes) written: 512 KB gets written in 0.4 secs !

The whole investigation journey could have been much shorter should we simply had run iostat and analyze the I/O latency. But that would be just a ‘matter of luck’. Even if the path is long, if you take the right direction from the very beginning it will definitely take you to the cause.
This is it for now! Hope you enjoyed !