This post is not about troubleshooting but rather about an interesting observation. I will start with a quick intro.
Visibility map is a fork of the relation which maintains two bits: one for visible, the other for frozen tuples. These bits set per page. If all tuples in a page are visible to all active transactions, the bit is then set. If at least one tuple is not so, then the bit is not set. These bits are set by vacuum only according to the docs. Although, you will never do it in production but truncate command also resets it which makes sense.
Weird thing can pop up if to consider how visibility map can be affected by failed transactions, although, at first, this may not sound as something that makes sense. Here is a quick demo about the point.
I am creating a table and running vacuum so that to have the relation’s _vm file in place.
postgres@ubuntu:~/18/main/base/5$ ls -lh *57449*-rw------- 1 postgres postgres 8.0K May 10 18:12 57449-rw------- 1 postgres postgres 24K May 10 18:12 57449_fsm-rw------- 1 postgres postgres 8.0K May 10 18:13 57449_vm
Let’s see what the bits are when the table is empty.
postgres=# select * from pg_visibility_map('customers', 0); all_visible | all_frozen -------------+------------ f | f(1row)
Good so far: table is empty and, hence, flags not set.
The all_visible flag gets cleared when a DML runs against the table. It can also be the case that the DML in actuality does not create any invisible tuple but tracking that would be too much overhead which is why the semantic of the DML cannot be checked. The bit is reset regardless of the DML.
postgres=# vacuum customers ;VACUUMpostgres=# select * from pg_visibility_map('customers', 0); all_visible | all_frozen -------------+------------ t | t(1row)postgres=# insert into customers values (1);INSERT01postgres=# select * from pg_visibility_map('customers', 0); all_visible | all_frozen -------------+------------ f | f(1row)
The other important point here is that the DML does not have to commit to reset the flag as can be witnessed below.
The flags are set here.
postgres=# vacuum customers;VACUUMpostgres=# select * from pg_visibility_map('customers', 0); all_visible | all_frozen -------------+------------ t | t(1row)
The other transaction updates the table but does not commit
postgres=# start transaction ;START TRANSACTIONpostgres=*# update customers set id = 2where id = 1;UPDATE2
and the flags get reset.
Here is the catch about all this. Suppose, transactions accessing that table (or its individual pages) fail for some reason (it could be due to a uncaught exception, for example) for a non-trivial period of time. From the other hand, queries access the table through index-only scan which needs those bits to avoid scanning the heap. This means in-between this time (start of the failure and the next vacuum run) the queries may suffer as they will do more heap fetches which would otherwise be avoided should the transactions run smoothly.
Lightweight locks (LWLocks) are a type of interprocess lock used by PostgreSQL to coordinate simultaneous access of multiple processes to a shared memory region. There are various reasons that can cause this lock to create issues in the database. I will now provide a short yet concise demo, followed by an exploration of the nature of LWLock in PostgreSQL through reference to its source code and OS stuff.
As a first step, I will generate some load on the database using pgbench. While not extremely flexible, this tool is adequate for testing some basics. The provided inputs are as follows.
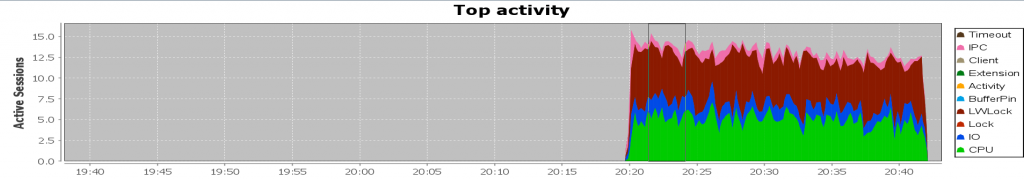
It spawns 10 (-j) worker threads to execute 10 (-c) concurrent processes, each of which runs 100,000 read-only queries as fast as possible (this is the default, and the rate is configurable as well). Visually, it appears as follows:
This is certainly not the behavior one would expect from a well-performing database with reasonable response times. The dark read LWLock prevails and we certainly need to bring it down. Typically, the LWLock is accompanied by I/O, as is the case here. However, this is not always the scenario, as a few other reasons may exist. Let’s assume we have no information about the database and try to figure out what is going on.
PostgreSQL introduced the pgsentinel extension, which, when loaded, samples the active sessions every second by default and makes the information available through the pg_active_session_history view. This allows querying what the sessions were doing at a particular point in time or within a range, making it very useful when diagnosing performance issues:
This is a bash script which connects to the database and queries data from pg_active_session_history view. The first list (wait_event_type, wait_event) is the grouping columns followed by the filter, and followed by the range in which we are interested.
From the output (as well as the chart), it becomes evident that the highlighted LWLock is the culprit, with approximately 10 sessions waiting for BufferMapping. This wait event occurs when a process is waiting to map a page from the disk to a buffer in the shared buffers. Once the necessary disk page has been identified, the process must find a free buffer in the buffer pool to load the page into. This is precisely what the processes are currently awaiting. Before we proceed to rerun the script and examine additional dimensions that may be helpful, let’s draw reasonable few conclusions here.
If the process cannot find a free buffer in the buffer pool, then the most likely suspect is that the “Shared buffers is full“. The (misleading) path to take then would (or could) be something like “Well, if it is full, then let’s add up some space.” Although a feasible yet rare solution in practice, the correct approach to handling it would be to ask, ‘What is polluting it?”. Well…definitely, the queries :)). Let’s then find out what these queries look like (only top 20 rows are returned, by default).
[postgres@centos8 home]$ ./ash wait_event_type,wait_event,query "backend_type='client backend'"'2023-11-24 20:29:00''2023-11-24 20:30:00'-------------------------------------------------------------------------------------------------------- wait_event_type | wait_event | query | samples | sessions-----------------+---------------+-----------------------------------------------------------+---------+---------- LWLock | BufferMapping | SELECT abalance FROM pgbench_accounts WHERE aid =1679538 | 5 | 1 CPU | CPU | SELECT abalance FROM pgbench_accounts WHERE aid =6508293 | 4 | 1 LWLock | BufferMapping | SELECT abalance FROM pgbench_accounts WHERE aid =649929 | 4 | 1 LWLock | BufferMapping | SELECT abalance FROM pgbench_accounts WHERE aid =6487070 | 4 | 1 CPU | CPU | SELECT abalance FROM pgbench_accounts WHERE aid =5088721 | 4 | 1 CPU | CPU | SELECT abalance FROM pgbench_accounts WHERE aid =9953261 | 4 | 1 CPU | CPU | SELECT abalance FROM pgbench_accounts WHERE aid =1659220 | 4 | 1 CPU | CPU | SELECT abalance FROM pgbench_accounts WHERE aid =9321817 | 3 | 1 CPU | CPU | SELECT abalance FROM pgbench_accounts WHERE aid =9104089 | 3 | 1IO | DataFileRead | SELECT abalance FROM pgbench_accounts WHERE aid =8129419 | 3 | 1 CPU | CPU | SELECT abalance FROM pgbench_accounts WHERE aid =1997345 | 3 | 1 CPU | CPU | SELECT abalance FROM pgbench_accounts WHERE aid =1172966 | 3 | 1 CPU | CPU | SELECT abalance FROM pgbench_accounts WHERE aid =513858 | 3 | 1 CPU | CPU | SELECT abalance FROM pgbench_accounts WHERE aid =9534579 | 3 | 1 CPU | CPU | SELECT abalance FROM pgbench_accounts WHERE aid =1393497 | 3 | 1 CPU | CPU | SELECT abalance FROM pgbench_accounts WHERE aid =3166138 | 3 | 1 CPU | CPU | SELECT abalance FROM pgbench_accounts WHERE aid =3735733 | 3 | 1 CPU | CPU | SELECT abalance FROM pgbench_accounts WHERE aid =2971116 | 3 | 1 CPU | CPU | SELECT abalance FROM pgbench_accounts WHERE aid =4772208 | 3 | 1 CPU | CPU | SELECT abalance FROM pgbench_accounts WHERE aid =2960432 | 3 | 1(20rows)
All sessions are executing the same query but passing different literals. They look very innocent: a small point query which (apparently; because the column “aid” looks like some sort of ID) returns just a single row). Remember, we have no information about the database – nothing at all. That is, we cannot allow some names, IDs, and etc. put us on the wrong path.
We now know what is polluting the buffer pool. So, we have to see why this query polluting it. The query explain plan will show us how the details of the query execution:
tpcc=# explain (analyze, buffers) SELECT abalance FROM pgbench_accounts WHERE aid =1679538; QUERY PLAN ------------------------------------------------------------------------------------------------------------------------------------ Gather (cost=1000.00..217018.43rows=1 width=4) (actual time=2434.719..2434.813rows=1 loops=1) Workers Planned: 2 Workers Launched: 2 Buffers: shared hit=12678read=151257-> Parallel Seq Scan on pgbench_accounts (cost=0.00..216018.33rows=1 width=4) (actual time=2166.930..2423.078rows=0 loops=3)Filter: (aid =1679538)Rows Removed byFilter: 3333333 Buffers: shared hit=12678read=151257 Planning: Buffers: shared hit=41read=1 Planning Time: 6.413 ms Execution Time: 2434.930 ms(12rows)
The query reads 151257 pages from disk to return a single row (rows=1). Luckily, 12678 are found in the shared buffer but still, 1.5k pages is way too high to spit out a single row. The other interesting aspect here is the second highlighted line: “Rows Removed by Filter: 3333333“. In actuality, the database didn’t remove this number of rows by filter. It is much more than that: 9999999. The explanation is in another LinkedIn post of mine :)).
So, the query reads lots of pages, out of which only one holds the necessary row. This is what actually pollutes the buffer. Adding an index on the filtering column will definitely make it much more better. As a result, the query will read only two pages: one from the index, another one from the table (unless the table/index is bloated). This is how things got better after the column has been indexed:
Continued… Now that it is clear how to deal with LWLock (at least in a typical case) related waits, it is also important to understand the implementation details of it. This time, we’ll delve into the details of how it is acquired (the release should be much simpler), and what actually counts as wait duration when the lock is being waited for. The current wait interface in PostgreSQL does not expose the duration of the wait. One of the first valid approaches is to examine the functions that execute when the process attempts to acquire the lock.
Let’s sample the stack trace with pstack and see what is going on (I’ve sampled it many times in a loop for a single process but will show only the top one here.):
[root@centos8 ~]# pstack 4391#0 0x00007fd95fd9cda6 in do_futex_wait.constprop () from /lib64/libpthread.so.0#1 0x00007fd95fd9ce98 in __new_sem_wait_slow.constprop.0 () from /lib64/libpthread.so.0#2 0x00000000007815a2 in PGSemaphoreLock (sema=0x7fd819711eb8) at pg_sema.c:327#3 0x00000000007fca6c in LWLockAcquire (lock=lock@entry=0x7fd819715580, mode=mode@entry=LW_EXCLUSIVE) at lwlock.c:1315#4 0x00000000007dbf8f in BufferAlloc (foundPtr=0x7fff9354e59b, strategy=0x1c7da98, blockNum=134785, forkNum=MAIN_FORKNUM, relpersistence=112 'p', smgr=0x1c3d8f8) at bufmgr.c:1320#5 ReadBuffer_common (smgr=0x1c3d8f8, relpersistence=<optimized out>, forkNum=MAIN_FORKNUM, blockNum=134785, mode=RBM_NORMAL, strategy=0x1c7da98, hit=0x7fff9354e647) at bufmgr.c:873#6 0x00000000007dc6f0 in ReadBufferExtended (reln=0x7fd96169d1f8, forkNum=forkNum@entry=MAIN_FORKNUM, blockNum=blockNum@entry=134785, mode=mode@entry=RBM_NORMAL, strategy=<optimized out>) at ../../../../src/include/utils/rel.h:560#7 0x0000000000549c66 in heapgetpage (sscan=sscan@entry=0x1c7cd18, page=page@entry=134785) at heapam.c:402#8 0x000000000054a1f6 in heapgettup_pagemode (scan=scan@entry=0x1c7cd18, dir=ForwardScanDirection, nkeys=0, key=0x0) at heapam.c:1120#9 0x000000000054b162 in heap_getnextslot (sscan=0x1c7cd18, direction=<optimized out>, slot=0x1c73270) at heapam.c:1352#10 0x00000000006cff6b in table_scan_getnextslot (slot=0x1c73270, direction=ForwardScanDirection, sscan=<optimized out>) at ../../../src/include/access/tableam.h:1046#11 SeqNext (node=node@entry=0x1c730d0) at nodeSeqscan.c:80#12 0x00000000006a9c52 in ExecScanFetch (recheckMtd=0x6cfeb0 <SeqRecheck>, accessMtd=0x6cfee0 <SeqNext>, node=0x1c730d0) at execScan.c:132#13 ExecScan (node=0x1c730d0, accessMtd=0x6cfee0 <SeqNext>, recheckMtd=0x6cfeb0 <SeqRecheck>) at execScan.c:198#14 0x00000000006ba8fa in ExecProcNode (node=0x1c730d0) at ../../../src/include/executor/executor.h:262#15 gather_getnext (gatherstate=0x1c72ee0) at nodeGather.c:295#16 ExecGather (pstate=0x1c72ee0) at nodeGather.c:227
Relevant lines are highlighted. The BufferAlloc function is responsible for seeking a free buffer. Once found, it will call LWLockAcquire which attempts to acquire the lock on the buffer. The remaining three functions (0, 1, and 2) suggest that the process is likely using a semaphore (in addition, some futex-related operations are also present) when it fails to acquire the lock.
What cannot be seen from here is whether the process sleeps or spins, and if it sleeps, then for how long. Tracing system calls can help us here. Their frequency and inputs can help us discern the nature of the waiting. Let’s strace it and see:
This is a portion of the trace. The futex syscall is not that frequently there. Moreover, on lines 15 and 16 there are two of them with different inputs. The one on line 15 makes the calling thread to sleep until awakened. This is because the fourth parameter, which determines the timeout of the sleep, is NULL. The next futex call wakes up a waiting thread. The third input is 1, indicating that only one thread must be awakened.
We now know how long a thread sleeps when it fails to acquire the lock — until it is woken up. Additionally, we have determined that there is either no or very little spinning.
We now peek at the source code. The call stack above shows that the LWLockAcquire is there in the lwlock.c file (irrelevant lines have been replaced with dots):
boolLWLockAcquire(LWLock *lock, LWLockMode mode){ ....................................................................for(;;){bool mustwait;/* * Try to grab the lock the first time, we're not in the waitqueue * yet/anymore.*/ mustwait =LWLockAttemptLock(lock, mode);if(!mustwait){LOG_LWDEBUG("LWLockAcquire", lock,"immediately acquired lock");break;/* got the lock */}/* add to the queue */LWLockQueueSelf(lock, mode);/* we're now guaranteed to be woken up if necessary */ mustwait =LWLockAttemptLock(lock, mode);/* ok, grabbed the lock the second time round, need to undo queueing */if(!mustwait){LOG_LWDEBUG("LWLockAcquire", lock,"acquired, undoing queue");LWLockDequeueSelf(lock);break;}/* * Wait until awakened. * * It is possible that we get awakened for a reason other than being * signaled by LWLockRelease. If so, loop back and wait again. Once * we've gotten the LWLock, re-increment the sema by the number of * additional signals received.*/LOG_LWDEBUG("LWLockAcquire", lock,"waiting");#ifdefLWLOCK_STATSlwstats->block_count++;#endifLWLockReportWaitStart(lock);if(TRACE_POSTGRESQL_LWLOCK_WAIT_START_ENABLED())TRACE_POSTGRESQL_LWLOCK_WAIT_START(T_NAME(lock), mode);for(;;){PGSemaphoreLock(proc->sem);if(!proc->lwWaiting)break; extraWaits++;}/* Retrying, allow LWLockRelease to release waiters again. */pg_atomic_fetch_or_u32(&lock->state, LW_FLAG_RELEASE_OK); ....................................................................LWLockReportWaitEnd();LOG_LWDEBUG("LWLockAcquire", lock,"awakened");/* Now loop back and try to acquire lock again. */ result =false;} ....................................................................return result;}
This is how it works. First, the process attempts to acquire the lock (line 13), and if unsuccessful, it queues itself up (line 21). The next attempt follows (line 24), and if successful, the process dequeues itself (line 31), allowing it to proceed when awakened. If it fails, it starts sleeping on a semaphore (line 55). Right before the sleep, the process registers a wait by calling LWLockReportWaitStart (line 49) and ends the wait by calling LWLockReportWaitEnd (line 64). The sleep ends when the process is awakened (line 57), and it retries to acquire the lock (line 62).
Therefore, the process of LWLock acquisition is more about sleeping than spinning. The duration of the wait is the time a process sleeps on a semaphore, excluding external waits. Just a few spins are negligible in comparison to this.
Here are some six ways that can be used to force a query go with sequential scan access method in PostgresSQL. The objective is to eliminate any index access in the query. The test table looks as follows.
postgres=# create table tablescandemo as select generate_series(1,100000) id;
SELECT 100000
postgres=# create index ind1demo on testtable1(id);
CREATE INDEX
Let’s get started.
Option I. Using enable_indexscan, enable_indexonlyscan and enable_bitmapscan parameters. The enable_indexscan parameter disables index access path. Let’s try it out.
postgres=# set enable_indexscan = off;
SET
postgres=# explain analyze select * from tablescandemo where id = 100;
                                                     QUERY PLAN
--------------------------------------------------------------------------------------------------------------------
 Bitmap Heap Scan on tablescandemo  (cost=12.17..482.50 rows=500 width=4) (actual time=0.039..0.041 rows=1 loops=1)
   Recheck Cond: (id = 100)
   Heap Blocks: exact=1
   ->  Bitmap Index Scan on inddemo  (cost=0.00..12.04 rows=500 width=0) (actual time=0.026..0.027 rows=1 loops=1)
         Index Cond: (id = 100)
 Planning Time: 0.568 ms
 Execution Time: 0.091 ms
(7 rows)
The planner still accesses the index but this time it is behaving differently. The index is accessed in the same way as in index scan method, however, as a result, the database doesn’t build a set of rowids of the heap rows but a bitmap: one bit per heap page. This is how the bitmap index scan works. The table is sequentially scanned and the bitmap is used to decide whether a particular page must be probed or not. The enable_bitmapscan parameter controls bitmap index scan access method:
postgres=# set enable_bitmapscan = off;
SET
postgres=# explain analyze select * from tablescandemo where id = 100;
                                                         QUERY PLAN
----------------------------------------------------------------------------------------------------------------------------
 Index Only Scan using inddemo on tablescandemo  (cost=0.29..4.31 rows=1 width=4) (actual time=0.070..0.071 rows=1 loops=1)
   Index Cond: (id = 100)
   Heap Fetches: 0
 Planning Time: 0.086 ms
 Execution Time: 0.094 ms
(5 rows)
Now, index only scan scan kicks in since the table has a single column which is indexed. Let’s turn it off as well:
postgres=# set enable_indexonlyscan = off;
SET
postgres=# explain analyze select * from tablescandemo where id = 100;
                                                QUERY PLAN
----------------------------------------------------------------------------------------------------------
 Seq Scan on tablescandemo  (cost=0.00..1693.00 rows=1 width=4) (actual time=0.021..9.114 rows=1 loops=1)
   Filter: (id = 100)
   Rows Removed by Filter: 99999
 Planning Time: 0.065 ms
 Execution Time: 9.137 ms
(5 rows)
Basically, once needs to make sure that not just one but all index access methods (index scan, index only scan and bitmap index scan) are off.
Option II. Using random_page_cost parameter. This parameter tells the optimizer the cost of a randomly accessed disk page. This concerns both index and table pages. Therefore, the higher this value, the more it should cost the optimizer to use index access path, especially, if the index is not very selective. Let’s see the experiment results (index scan, index only scan and bitmap index scan control parameter values are all on now):
postgres=# set random_page_cost = 100000;
SET
postgres=# explain analyze select * from tablescandemo where id = 100;
                                                QUERY PLAN
-----------------------------------------------------------------------------------------------------------
 Seq Scan on tablescandemo  (cost=0.00..1693.00 rows=1 width=4) (actual time=0.034..10.175 rows=1 loops=1)
   Filter: (id = 100)
   Rows Removed by Filter: 99999
 Planning Time: 0.071 ms
 Execution Time: 10.200 ms
(5 rows)
The optimizer estimates that retrieving tuple(s) via the index will be higher than sequential scan and, hence, prefers solely the latter.
OptionIII. Altering table statistics. At the end of the day, optimizer uses database statistics which one can actually fake. Selectivity of the predicate is the primary factor in deciding which access path to take. It is based on the cardinality which itself calculated as the number of tuples that qualify the predicate. The latter is (assuming no extended statistics exist) nothing but N/NDV where N is the number of tuples in the table and NDV is the number of distinct values of the column. The higher the NDV, the more selective the predicate is, and, thus, the higher the probability that the optimizer leans towards index access rather than sequential scan. Therefore, if NDV is low, the optimizer will think that most of the table tuples qualify: that is, index access will cost much more than sequential scan, thus, preferring the latter. Let’s check it out.
postgres=# alter table tablescandemo alter column id set (n_distinct = 1);
ALTER TABLE
postgres=# analyze tablescandemo;
ANALYZE
postgres=# explain analyze select * from tablescandemo where id = 100;
                                                  QUERY PLAN
---------------------------------------------------------------------------------------------------------------
 Seq Scan on tablescandemo  (cost=0.00..1693.00 rows=100000 width=4) (actual time=0.015..6.366 rows=1 loops=1)
   Filter: (id = 100)
   Rows Removed by Filter: 99999
 Planning Time: 0.098 ms
 Execution Time: 6.379 ms
(5 rows)
OptionIV. ‘Hacking’ table statistics. Even though the previous option is a valid one, it has two drawbacks: 1) alter table command will lock the table in exclusive mode and 2) analyze table may take considerable amount of time depending on the size of the table. So, if that is the case, then you can update statistics directly in the pg_statistic table. Surely, this is not an accurate way but still works and in extreme cases may come in handy:
postgres=# update pg_statistic set stadistinct = 1 where starelid = (select oid from pg_class where relname = 'tablescandemo');;
UPDATE 1
postgres=# explain analyze select * from tablescandemo where id = 6;
                                             QUERY PLAN
-----------------------------------------------------------------------------------------------------
 Seq Scan on tablescandemo(cost=0.00..1693.00 rows=100000 width=4) (actual time=0.008..6.612 rows=1 loops=1)
   Filter: (id = 6)
   Rows Removed by Filter: 99999
 Planning Time: 0.115 ms
 Execution Time: 6.625 ms
(5 rows)

postgres=#
OptionV. ‘Hacking’ table statistics (Part II). Another statistics you can fake is number of pages a table contains. The lesser it is, the higher the probability that sequential scan will kick in. This information is kept in pg_class table and can be manipulated just like any other column value:
postgres=# update pg_class set reltuples=1 where relname = 'tablescandemo';
UPDATE 1
postgres=# explain analyze select * from tablescandemo where id = 6;
                                          QUERY PLAN
-----------------------------------------------------------------------------------------------
 Seq Scan on tablescandemo(cost=0.00..443.01 rows=1 width=4) (actual time=0.010..6.496 rows=1 loops=1)
   Filter: (id = 6)
   Rows Removed by Filter: 99999
 Planning Time: 0.138 ms
 Execution Time: 6.511 ms
(5 rows)
postgres=#
OptionVI. Using hints. PostgreSQL does not support hints out-of-the-box. However, you can use pg_hint_plan to hint queries. It provides hints for scan methods, join methods, join order, parallelism, row number correction and few others.
One of the questions that a colleague of mine recently asked was: “How can I find out how much swap space a PostgreSQL process is really using?”. This triggered a piece of curiosity which I will talk about in this post.
At first, it might seem like we can use the Linux top command which has memory related columns. Let’s run it for an arbitrary process and see the output:
[root@localhost ~]# top -p 3748

top - 00:42:16 up 3 days,  7:43,  5 users,  load average: 0.00, 0.01, 0.05
Tasks:   1 total,   0 running,   1 sleeping,   0 stopped,   0 zombie
%Cpu(s):  0.0 us,  0.1 sy,  0.0 ni, 99.9 id,  0.0 wa,  0.0 hi,  0.0 si,  0.0 st
KiB Mem : 16266588 total, 15392968 free,   233036 used,   640584 buff/cache
KiB Swap:  1679356 total,  1615172 free,    64184 used. 15566964 avail Mem

  PID USER      PR  NI    VIRT    RES    SHR S  %CPU %MEM     TIME+ COMMAND               SWAP
3748 postgres  20   0 8851352   4520   3344 S   0.0  0.0   0:00.01 postmaster             972
The top command reports that the process (pid 3748, line 9, last column) is utilizing 972 KB of swap space. There are three questions here: 1) Is this really swap and the OS does not fake it? 2) If it is, then how accurate is this number? 3) Why does the OS allocate swap to this process while there is free RAM?
Here, I will try to answer the first two questions (third one is for another post).
According to the Linux top manual the reported swap column can include any of the quadrants from #1 through #3 each of which includes memory pages allocated via certain functions. For example, quadrant #1 includes process stack and this does not actually tell anything about being swapped. It only tells us that memory pages allocated for process stack are eligible for being swapped in/out.
So, how can we find out then how much of the process address space is mapped and really is on the swap file?
To answer this question, let’s get back to some fundamentals.
A Linux process is provided with a virtual address range. A page from an address from this range can be allocated either from RAM or secondary storage (HDD, SSD, etc.). The process page table maintains mapping from a virtual address to a physical address. Moreover, it also holds control bits each of which tracks some information about the page, e.g., dirty bit in the page table indicates whether the page’s content is in sync with the disk, unevictable bit indicates that the page cannot be evicted from the LRU list, and so on. This information can be queried from /proc/kpageflags file which in the latest kernel holds 26 flags.
Two of the flags are related to swapping out of which swapcache is the one we need. This bit indicates whether the page table entry (PTE) has an associated swap entry.
Let’s now see how we can calculate the total swap space occupied by a process.
The environment for experiments is PostgreSQL 14 running on CentOS 7.7. Let’s first connect to the database and retrieve it’s OS PID to have a process to work with:
-bash-4.2$ psql postgres
psql (14.2)
Type "help" for help.

postgres=# select pg_backend_pid();
 pg_backend_pid
----------------
          16460
(1 row)
The next step is to get swapcache bit value for every page in every PTE for this process. This information is available in /proc/$PID/pagemaps from where we can find out which physical frame a virtual page is mapped to (the process page table) and flag values (this file must be parsed to be human readable; I used the parser available here). For the sake of demonstration, I will show just a single range of virtual addresses which can be obtained from /proc/$PID/maps.
The file holds all virtual address ranges for a process including libraries associated with each range, permissions and etc:
As an example, consider line 1 of the output. The first value is the virtual address 0x7f585720f000 followed by the pfn: 3e2942 (page frame number – the actual physical address of the frame in hexadecimal), followed by attribute names and their values. For this address we see that swapped bit is 0. This is what we were looking for. Thus, for any page from the process page table, we can get the bit value which tells us whether the page is associated with a swap entry.
However, just the fact that the page is mapped to a swap entry does not yet mean that it has been been swapped out. We also have to make sure that the associated page in the swap space is been used. This can be obtained by looking at the locked bit in /proc/kpageflags which is set when a page has exclusively been locked by the process (e.g., when doing I/O). As seen from the last output, the pagemap parser does not report this bit but this can be added. Moreover, the parser has also another executable (pagemap2) which prints all pages of a process.
To sum up, the actual swap space used by a process can be calculated as the number of pages with swapped and locked bits both set times the page size. I will not pretend that I have written a script that calculates it for a running process but making one seems to be a good idea that can help troubleshooting in certain memory-related scenarios.
Note: Although the motivation originated from a PostgreSQL database related problem, the approach should be valid for an arbitrary user process.
In Part I of this series I was investigating the effect of fillfactor parameter in Postgres 14.1. It turned out that the database does not always store the updated version of a tuple on a new page whereas it should, at least because of the default value of fillfactor=100.
Now, I will investigate the source code to see what prevents the database from doing it so.
This time I used a table with less number of columns to exclude the The Oversized-Attribute Storage Technique (TOAST). This is how PostgreSQL manages to store large field values since it does not support spanning a tuple across multiple pages.
Size of the table is 8KB and fillfactor has default value of 100.
select * from pg_total_relation_size('fillfactortable');
pg_total_relation_size
----------------
 8192 bytes
(1 row)
To find out how a tuple is updated let’s take a look at the source code. The routine that does it starts at line 3155 in \src\backend\access\heap\heapam.c:
The newbuff parameter’s value decides whether the updated version of the tuple will be on the same page or not. This decision is based on the following condition (line 3670):
pagefree = PageGetHeapFreeSpace(page);
newtupsize = MAXALIGN(newtup->t_len);
if (need_toast || newtupsize > pagefree)
{
..........................................
}
else
	{
		/* No TOAST work needed, and it'll fit on same page */
		newbuf = buffer;
		heaptup = newtup;
	}
In my scenario need_toast is false since the table has just six attributes of varchar(30). Moreover, should there be another page for TOAST the pg_total_relation_size function would return 16KB since additional page would have been allocated. This can be confirmed also by querying pg_class with the corresponding value for oid column. That is, newtupsize > pagefree evaluating to false is the only case when the new version of the tuple is placed on the same page since it is that case newbuf = buffer. This is actually what happens because pagefree receives a value greater than newtupsize.
To investigate it further, let’s see how PageGetHeapFreeSpace works which can be found at line 899 in \src\backend\storage\page\bufpage.c:
Size
PageGetFreeSpace(Page page)
{
	int			space;

	/*
	 * Use signed arithmetic here so that we behave sensibly if pd_lower >
	 * pd_upper.
	 */
	space = (int) ((PageHeader) page)->pd_upper -
		(int) ((PageHeader) page)->pd_lower;

	if (space < (int) sizeof(ItemIdData))
		return 0;
	space -= sizeof(ItemIdData);

	return (Size) space;
}
Here, pd_upper and pd_lower is offset of end of free space and start of free space in a page relatively. By doing this subtraction pd_upper – pd_lower it calculates available space between between the end of line pointers and start of tuple values. This condition then (line 13 in the last block) if (space < (int) sizeof(ItemIdData)) checks how much space is left ultimately after deducting space taken by the line pointers.
Let’s what the values are for pd_upper and pd_lower in the table (Heads up! No fillfactor involvement so far!):
That is, the page has 8096-28=8068 bytes free. From this the space taken by the single line pointer (4 bytes) has to be subtracted as well which gives 8064 value for the pagefree parameter which is greater than the tuple size which is itself few tens of bytes in size.
Summary: A table with fillfactor=100 does not place the new version of the updated tuple on the same page what should not be the case according to the documentation. The tuple update routine makes use of PageGetFreeSpace function to decide whether the new version of the updated tuple resides on the same page. Neither the caller nor the routine itself make use fillfactor value. The routine calculates free spaced based on pd_upper and pd_lower and line pointers. In this scenario, pagefree should have been zero in which case the database would allocate additional page and place the new version of the tuple on this new page. As demonstrated, this did not happen even though fillfactor was set to 100. In Part III of this post series I will investigate cases when it does occur.
The purpose of FILLFACTOR in PostgreSQL is widely known. According to the documentation, the default value of 100 means complete packing. That is, the new version of a tuple will be placed on a different page. Here is a simple experiment that demonstrates that this is not always the case.
That is, the table still has only one page i.e. no page has been allocated to store the other version of the updated tuple which should have not happened according to the documentation. In Part II of this topic, I will explore the cases when this happens.