One of databases running on Oracle 12.1 was hanging for some minutes. The top wait event was log file sync. This wait event is posted whenever a user session issues COMMIT or ROLLBACK. A message is then sent to LGWR to flush logs associated with the transaction from the log buffer to redo log files. Redo storage slowness can cause high number of this wait event too. Ultimate blocker in either case is LGWR.
In most cases (but not always), high commit frequency is the cause and should be resolved (decreased) on the application side. That was not the case this time. The reason was the fact that a session (just a single one) issued lots DML statements which generated huge amount of redo. Once the session issued commit, it took quite a long for LGWR to flush redo from the log buffer to the disk. That stalled all other sessions because LGWR was busy and committing sessions were stuck as well. The transaction logic must be changed in the application to issue intermittent commits and not to commit only once when it ends.
Fadai Ganjaliyev
Library cache: mutex X and another slowness scenario (briefly)
One of databases was eventually going completely unresponsive and didn’t resume normal execution until the suspected SQL was manually flushed from the shared pool. AWR indicates that library cache: mutex X wait event prevails. The fact that this mutex is taken whenever the corresponding library cache bucket is changed is well known.
So, the first suspect in case of this wait event is hard parse that can be caused by, for example, undersized shared pool, high version counts and etc. Another cause can be CPU saturation which prevents a thread from jumping on the CPU so that the necessary mutex will be released. This time no hard parses at all. At least, not so much as to worry about.
Looks like there are other cases (not hard parse related) that can cause the library cache bucket mutex to be taken exclusively. For example, execution count of a statement which is held in the parent statement. Whenever a statistics need to be changed the mutex must be held in exclusive mode. This fits very well when we observe that a statement executed ~30,000,000 times, during the other occurrence of the issue ~28,000,000 times within 10 minutes. Once this loop will be removed/replaced, the issue will most probably be gone.
DBWR and the Shared Pool – Part II
Buffer cache from SGA holds data blocks that a server process reads from disk storage. This is well known. Access to these data blocks in the memory is done via buffer headers that store data block metadata, such as touch count, dirty flag and etc. For example, when a server process needs to access a particular data block in memory the DBA is hashed and bucket where that buffer header would be is returned. Then the latch: cache buffers chains latch that protects this bucket from simultaneous access is acquired. Now, this latch is set not on the buffers themselves but their headers, on the array of the headers, to be more precise. The latter contains pointers to actual data buffers. So, once you land on a header in the chain, you follow the pointer to jump on the actual buffer frame.
DBW also eventually accesses buffer header array, for example, during a checkpoint: it needs to know which buffers are dirty and which are not. Array of buffer headers is externalized in x$bh which comes in handy when troubleshooting, for example, latch contention. It contains lots of other useful information which actually tells you that buffer header array is implemented as a doubly linked list (NXT_HASH and PRV_HASH columns).
According to some sources this structure is stored in the buffer cache itself. Other sources state that it lies in the shared pool.
Now, back to prior post named DWB and the shared pool where I wondered why the DBW should access the shared pool. So, if the buffer header array is indeed stored in the shared pool and not the buffer cache then it makes that clear. Remains to prove it, if so.
In Part III, I’ll come up with quick demos to show whether the buffer header chain is indeed in the shared pool or not. Stay tuned…
On ORDER BY clause removal by the CBO
CBO is smart enough. It kicks in whenever you issue a query and can apply lots of tricks to simplify query processing. So, another thing it can do is elimination of the ORDER BY clause from a query. This can be useful to know if you expect sorting in the plan which does not show up and you have to know the “why”. For example, consider the following query:
SELECT * FROM TESTTABLE1 S WHERE ID = 6 ORDER BY ID;Looks like the plan should have a SORT ORDER BY operator which is not the case:
Plan hash value: 3427422027

————————————————————————————————————————————————
| Id  | Operation                              | Name             | Rows | Bytes | Cost (%CPU)  | Time      |
————————————————————————————————————————————————
| 0   | SELECT STATEMENT                       |                         | 2501 | 1292K| 122           (0)    | 00:00:01 |
|* 1 |     TABLE ACCESS FULL                   | TESTTABLE1 | 2501 | 1292K| 122           (0)    | 00:00:01 |
————————————————————————————————————————————————

Predicate Information (identified by operation id):
—————————————————
Let’s see what happens behind the scene via the CBO trace:
OBYE: Order by element marked for removal from query block SEL$1 (#0) equality filter pred
“ID”
OBYE: Removed ORDER BY from query block SEL$1 (#0)
Registered qb: SEL$9FB2EC53 0xbf94df8 (ORDER BY REMOVED FROM QUERY BLOCK SEL$1; SEL$1)

Final query after transformations:******* UNPARSED QUERY IS *******
SELECT [not showing columns here] FROM “TESTTABLE1” WHERE “TESTTABLE1”.”ID”=6
kkoqbc: optimizing query block SEL$9FB2EC53 (#0)
So, the CBO sees an equality predicate and decides to remove the ORDER BY clause from it. This makes sense because no matter what the cardinality is – all values going to be the same – no need to do any sorting, therefore. It works in 12.1 and later; didn’t check it for earlier versions. So, no surprise why we expect sorting but don’t observe it in the final plan.
This can be controlled via “_optimizer_order_by_elimination_enabled” undocumented parameter. Plus, two hints are also there for switching it on and off: /*+ ELIMINATE_OBY */ and /*+ NO_ELIMINATE_OBY */.
INDEX FULL SCAN and Sorting Avoidance
Cases when sorting is avoided are quite known. Let’s take a look at yet another one when the optimizer ends up with a Sort Merge Join join method to execute a query. The query is a simple one and serves demonstrations purposes only:
select * from student s, takes t where s.id = t.idwith the following final plan:
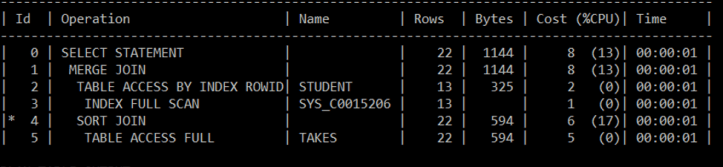
The plan tells us that Sort Merge Join is used to join the two tables.
The table at the bottom of the page is an exert from from the optimizer trace file to highlight some points (line numbers have been added).
Line 193: only 2 permutations are possible: STUDENT is outer table and TAKES is inner and visa versa.
To remind, number of permutations can be controlled by the _optimizer_max_permutations undocumented parameter which defaults to 2000.
Line 1: the optimizer starts estimating plan costs for the case when STUDENT is outer table and TAKES is inner.
Line 6: Nested Loop join is estimated and cost is 45 (line 20) when inner table TAKES is accessed by Full Scan (line 18) and is 30 (line 32) when TAKES is accessed via Range Scan by the index SYS_C0014106. Out of these two ways, the latter is a better one with less cost (line 35).
Line 63: The optimizer estimates cost for Sort Merge Join which is 12.002240. This is a case when both tables get sorted: STUDENT at line 45 and TAKES at line 56. For example, STUDENT table has only one block, so just one block needs to be sorted, line 49. There is just one run to sort and this is one-pass sort – no subsequent passes, hence # of merge passes is 0, line 50.
The optimizer picks up the plan with SMJ with cost 8.001695, lines 98 and 99 and this is where things get interesting (on line 104 the tables are swapped and other plans are considered and etc.).
Cost estimation for this plan kicks in on line 65: SM Join (with index on outer).
The outer table STUDENT is accessed via index SYS_C0015206 and by INDEX FULL SCAN access path, line 68. Cost of this access is: 2.000510, line 72 (resc_cpu is CPU cost of access and ix_sel: 1.000000 is index selectivity: fraction of rows that qualify). What we observe is there is no sorting associated with this table here. Only inner table TAKES gets sorted, on line 81.
In case of INDEX FULL SCAN the database first lands on the leftmost leaf node of the index tree and then scans the index in the other direction i.e. scans the data in the order it is held in the index. Data in the index is sorted already. SYS_C0015206 is a PK on the ID column of the STUDENT table. So, it works as follows: get every entry from the index, get the rowid and fetch the table row by the rowid and the resultant data will be sorted by the ID column because from the index we get the data in a sorted manner. Hence, no need to invoke sorting on the table itself to prepare it for the Sort Merge Join: is actually what we observe from the plan. Here are the steps the database takes to execute it according to that plan (numbers are steps of the optimizer).
5 and 4: SORT JOIN
TABLE ACCESS FULL
Here, the table TAKES is scanned fully and then sorted.
3 and 2: TABLE ACCESS BY INDEX ROWID (note that no sorting is here)
INDEX FULL SCAN
Here, the table STUDENT is accessed via index.
1: MERGE JOIN
Finally, invoking Sort Merge Join to join the two tables.
So, we have seen yet another case when the optimizer may skip sorting due an index on the join column.
| 1 | Join order[1]: STUDENT[S]#0 TAKES[T]#1 |
| 2 | |
| 3 | *************** |
| 4 | Now joining: TAKES[T]#1 |
| 5 | *************** |
| 6 | NL Join |
| 7 | Outer table: Card: 13.000000 Cost: 5.000998 Resp: 5.000998 Degree: 1 Bytes: |
| 8 | Access path analysis for TAKES |
| 9 | Scan IO Cost (Disk) = 3.076923 |
| 10 | Scan CPU Cost (Disk) = 41107.200000 |
| 11 | Total Scan IO Cost = 3.076923 (scan (Disk)) |
| 12 | + 0.000000 (io filter eval) (= 0.000000 (per row) * 22.000000 (#rows)) |
| 13 | 3.076923 |
| 14 | Total Scan CPU Cost = 41107.200000 (scan (Disk)) |
| 15 | + 1100.000000 (cpu filter eval) (= 50.000000 (per row) * 22.000000 (#rows)) |
| 16 | 42207.2 |
| 17 | Inner table: TAKES Alias: T |
| 18 | Access Path: TableScan |
| 19 | NL Join: Cost: 45.015282 Resp: 45.015282 Degree: 1 |
| 20 | Cost_io: 45.000000 Cost_cpu: 587031 |
| 21 | Resp_io: 45.000000 Resp_cpu: 587031 |
| 22 | ****** Costing Index SYS_C0014106 |
| 23 | SPD: Return code in qosdDSDirSetup: NOCTX, estType = INDEX_SCAN |
| 24 | |
| 25 | SPD: Return code in qosdDSDirSetup: NOCTX, estType = INDEX_FILTER |
| 26 | |
| 27 | Access Path: index (RangeScan) |
| 28 | Index: SYS_C0014106 |
| 29 | resc_io: 2.000000 resc_cpu: 15143 |
| 30 | ix_sel: 0.083333 ix_sel_with_filters: 0.083333 |
| 31 | NL Join : Cost: 30.005924 Resp: 30.005924 Degree: 1 |
| 32 | Cost_io: 30.000000 Cost_cpu: 227573 |
| 33 | Resp_io: 30.000000 Resp_cpu: 227573 |
| 34 | |
| 35 | Best NL cost: 30.005924 |
| 36 | resc: 30.005924 resc_io: 30.000000 resc_cpu: 227573 |
| 37 | resp: 30.005924 resp_io: 30.000000 resc_cpu: 227573 |
| 38 | SPD: Return code in qosdDSDirSetup: NOCTX, estType = JOIN |
| 39 | Join Card: 22.000000 = outer (13.000000) * inner (22.000000) * sel (0.076923) |
| 40 | Join Card – Rounded: 22 Computed: 22.000000 |
| 41 | Outer table: STUDENT Alias: S |
| 42 | resc: 5.000998 card 13.000000 bytes: deg: 1 resp: 5.000998 |
| 43 | Inner table: TAKES Alias: T |
| 44 | resc: 5.001070 card: 22.000000 bytes: deg: 1 resp: 5.001070 |
| 45 | using dmeth: 2 #groups: 1 |
| 46 | SORT ressource Sort statistics |
| 47 | Sort width: 118 Area size: 131072 Max Area size: 20971520 |
| 48 | Degree: 1 |
| 49 | Blocks to Sort: 1 Row size: 38 Total Rows: 13 |
| 50 | Initial runs: 1 Merge passes: 0 IO Cost / pass: 0 |
| 51 | Total IO sort cost: 0.000000 Total CPU sort cost: 38415391 |
| 52 | Total Temp space used: 0 |
| 53 | SORT resource Sort statistics |
| 54 | Sort width: 118 Area size: 131072 Max Area size: 20971520 |
| 55 | Degree: 1 |
| 56 | Blocks to Sort: 1 Row size: 40 Total Rows: 22 |
| 57 | Initial runs: 1 Merge passes: 0 IO Cost / pass: 0 |
| 58 | Total IO sort cost: 0.000000 Total CPU sort cost: 38417643 |
| 59 | Total Temp space used: 0 |
| 60 | SM join: Resc: 12.002240 Resp: 12.002240 [multiMatchCost=0.000000] |
| 61 | SM Join |
| 62 | SM cost: 12.002240 |
| 63 | resc: 12.002240 resc_io: 10.000000 resc_cpu: 76912478 |
| 64 | resp: 12.002240 resp_io: 10.000000 resp_cpu: 76912478 |
| 65 | SM Join (with index on outer) |
| 66 | ****** Costing Index SYS_C0015206 |
| 67 | SPD: Return code in qosdDSDirSetup: NOCTX, estType = INDEX_FILTER |
| 68 | Access Path: index (FullScan) |
| 69 | Index: SYS_C0015206 |
| 70 | resc_io: 2.000000 resc_cpu: 19573 |
| 71 | ix_sel: 1.000000 ix_sel_with_filters: 1.000000 |
| 72 | Cost: 2.000510 Resp: 2.000510 Degree: 1 |
| 73 | Outer table: STUDENT Alias: S |
| 74 | resc: 2.000510 card 13.000000 bytes: deg: 1 resp: 2.000510 |
| 75 | Inner table: TAKES Alias: T |
| 76 | resc: 5.001070 card: 22.000000 bytes: deg: 1 resp: 5.001070 |
| 77 | using dmeth: 2 #groups: 1 |
| 78 | SORT ressource Sort statistics |
| 79 | Sort width: 118 Area size: 131072 Max Area size: 20971520 |
| 80 | Degree: 1 |
| 81 | Blocks to Sort: 1 Row size: 40 Total Rows: 22 |
| 82 | Initial runs: 1 Merge passes: 0 IO Cost / pass: 0 |
| 83 | Total IO sort cost: 0.000000 Total CPU sort cost: 38417643 |
| 84 | Total Temp space used: 0 |
| 85 | SM join: Resc: 8.001695 Resp: 8.001695 [multiMatchCost=0.000000] |
| 86 | Outer table: STUDENT Alias: S |
| 87 | resc: 5.000998 card 13.000000 bytes: deg: 1 resp: 5.000998 |
| 88 | Inner table: TAKES Alias: T |
| 89 | resc: 5.001070 card: 22.000000 bytes: deg: 1 resp: 5.001070 |
| 90 | using dmeth: 2 #groups: 1 |
| 91 | Cost per ptn: 0.015728 #ptns: 1 |
| 92 | hash_area: 124 (max=5120) buildfrag: 1 probefrag: 1 ppasses: 1 |
| 93 | Hash join: Resc: 10.017796 Resp: 10.017796 [multiMatchCost=0.000000] |
| 94 | HA Join |
| 95 | HA cost: 10.017796 |
| 96 | resc: 10.017796 resc_io: 10.000000 resc_cpu: 683594 |
| 97 | resp: 10.017796 resp_io: 10.000000 resp_cpu: 683594 |
| 98 | Best:: JoinMethod: SortMerge |
| 99 | Cost: 8.001695 Degree: 1 Resp: 8.001695 Card: 22.000000 Bytes: |
| 100 | *********************** |
| 101 | Best so far: Table#: 0 cost: 2.000510 card: 13.000000 bytes: 325.000000 |
| 102 | Table#: 1 cost: 8.001695 card: 22.000000 bytes: 1144.000000 |
| 103 | *********************** |
| 104 | Join order[2]: TAKES[T]#1 STUDENT[S]#0 |
| 105 | |
| 106 | *************** |
| 107 | Now joining: STUDENT[S]#0 |
| 108 | *************** |
| 109 | NL Join |
| 110 | Outer table: Card: 22.000000 Cost: 5.001070 Resp: 5.001070 Degree: 1 Bytes: |
| 111 | Access path analysis for STUDENT |
| 112 | Scan IO Cost (Disk) = 3.000000 |
| 113 | Scan CPU Cost (Disk) = 38337.200000 |
| 114 | Total Scan IO Cost = 3.000000 (scan (Disk)) |
| 115 | + 0.000000 (io filter eval) (= 0.000000 (per row) * 13.000000 (#rows)) |
| 116 | 3 |
| 117 | Total Scan CPU Cost = 38337.200000 (scan (Disk)) |
| 118 | + 650.000000 (cpu filter eval) (= 50.000000 (per row) * 13.000000 (#rows)) |
| 119 | 38987.2 |
| 120 | Inner table: STUDENT Alias: S |
| 121 | Access Path: TableScan |
| 122 | NL Join: Cost: 71.023399 Resp: 71.023399 Degree: 1 |
| 123 | Cost_io: 71.000000 Cost_cpu: 898826 |
| 124 | Resp_io: 71.000000 Resp_cpu: 898826 |
| 125 | ****** Costing Index SYS_C0015206 |
| 126 | SPD: Return code in qosdDSDirSetup: NOCTX, estType = INDEX_SCAN |
| 127 | SPD: Return code in qosdDSDirSetup: NOCTX, estType = INDEX_FILTER |
| 128 | Access Path: index (UniqueScan) |
| 129 | Index: SYS_C0015206 |
| 130 | resc_io: 1.000000 resc_cpu: 8381 |
| 131 | ix_sel: 0.076923 ix_sel_with_filters: 0.076923 |
| 132 | NL Join : Cost: 27.005870 Resp: 27.005870 Degree: 1 |
| 133 | Cost_io: 27.000000 Cost_cpu: 225499 |
| 134 | Resp_io: 27.000000 Resp_cpu: 225499 |
| 135 | ****** Costing Index SYS_C0015206 |
| 136 | SPD: Return code in qosdDSDirSetup: NOCTX, estType = INDEX_SCAN |
| 137 | SPD: Return code in qosdDSDirSetup: NOCTX, estType = INDEX_FILTER |
| 138 | Access Path: index (AllEqUnique) |
| 139 | Index: SYS_C0015206 |
| 140 | resc_io: 1.000000 resc_cpu: 8381 |
| 141 | ix_sel: 0.076923 ix_sel_with_filters: 0.076923 |
| 142 | NL Join : Cost: 27.005870 Resp: 27.005870 Degree: 1 |
| 143 | Cost_io: 27.000000 Cost_cpu: 225499 |
| 144 | Resp_io: 27.000000 Resp_cpu: 225499 |
| 145 | |
| 146 | Best NL cost: 27.005870 |
| 147 | resc: 27.005870 resc_io: 27.000000 resc_cpu: 225499 |
| 148 | resp: 27.005870 resp_io: 27.000000 resc_cpu: 225499 |
| 149 | SPD: Return code in qosdDSDirSetup: NOCTX, estType = JOIN |
| 150 | Join Card: 22.000000 = outer (22.000000) * inner (13.000000) * sel (0.076923) |
| 151 | Join Card – Rounded: 22 Computed: 22.000000 |
| 152 | Outer table: TAKES Alias: T |
| 153 | resc: 5.001070 card 22.000000 bytes: deg: 1 resp: 5.001070 |
| 154 | Inner table: STUDENT Alias: S |
| 155 | resc: 5.000998 card: 13.000000 bytes: deg: 1 resp: 5.000998 |
| 156 | using dmeth: 2 #groups: 1 |
| 157 | SORT ressource Sort statistics |
| 158 | Sort width: 118 Area size: 131072 Max Area size: 20971520 |
| 159 | Degree: 1 |
| 160 | Blocks to Sort: 1 Row size: 40 Total Rows: 22 |
| 161 | Initial runs: 1 Merge passes: 0 IO Cost / pass: 0 |
| 162 | Total IO sort cost: 0.000000 Total CPU sort cost: 38417643 |
| 163 | Total Temp space used: 0 |
| 164 | SORT ressource Sort statistics |
| 165 | Sort width: 118 Area size: 131072 Max Area size: 20971520 |
| 166 | Degree: 1 |
| 167 | Blocks to Sort: 1 Row size: 38 Total Rows: 13 |
| 168 | Initial runs: 1 Merge passes: 0 IO Cost / pass: 0 |
| 169 | Total IO sort cost: 0.000000 Total CPU sort cost: 38415391 |
| 170 | Total Temp space used: 0 |
| 171 | SM join: Resc: 12.002240 Resp: 12.002240 [multiMatchCost=0.000000] |
| 172 | SM Join |
| 173 | SM cost: 12.002240 |
| 174 | resc: 12.002240 resc_io: 10.000000 resc_cpu: 76912478 |
| 175 | resp: 12.002240 resp_io: 10.000000 resp_cpu: 76912478 |
| 176 | Outer table: TAKES Alias: T |
| 177 | resc: 5.001070 card 22.000000 bytes: deg: 1 resp: 5.001070 |
| 178 | Inner table: STUDENT Alias: S |
| 179 | resc: 5.000998 card: 13.000000 bytes: deg: 1 resp: 5.000998 |
| 180 | using dmeth: 2 #groups: 1 |
| 181 | Cost per ptn: 0.015739 #ptns: 1 |
| 182 | hash_area: 124 (max=5120) buildfrag: 1 probefrag: 1 ppasses: 1 |
| 183 | Hash join: Resc: 10.017831 Resp: 10.017831 [multiMatchCost=0.000023] |
| 184 | HA Join |
| 185 | HA cost: 10.017831 |
| 186 | resc: 10.017831 resc_io: 10.000000 resc_cpu: 684944 |
| 187 | resp: 10.017831 resp_io: 10.000000 resp_cpu: 684944 |
| 188 | Join order aborted: cost > best plan cost |
| 189 | *********************** |
| 190 | (newjo-stop-1) k:0, spcnt:0, perm:2, maxperm:2000 |
| 191 | |
| 192 | ********************************* |
| 193 | Number of join permutations tried: 2 |
| 194 | ********************************* |
Feeding intelligence into synchronization primitives
This is a brief overview of my recent paper where I am reasoning about application of machine learning to synchronization methods, in particular, to spinlock protocols. Research around spinlocks is quite extensive, although machine learning techniques there are rare. As to my knowledge, there has been just one work so far that has been dealing with integration of machine leaning into spinlocks: Smartlocks: Self-aware Synchronization through Lock Acquisition Scheduling developed at MIT in 2009 by great researchers. The main idea of this work is to use performance metrics of the application that are measured via an API that sends heartbeats to the machine learning engine. The engine, then, works out an optimal policy which the threads utilize to intelligently organize their behavior.
My focus is on hybrid methods where threads should decide whether they should spin or park out. This decision is hard to make because of unpredictability of the system load (which is very crucial for the application performance) and number of threads that can ever contend for the lock. Perhaps, a way out can be to let the thread learn and decide themselves rather than hard code it. But they should decide about it to make it good both for themselves (to acquire the lock as fast as possible by burning as less as possible CPU cycles) and for the system (avoid making the system too oversubscribed). This sounds just like Russel Crowe starring as John Nash in “Beautiful Mind” exclaims “The best for the group comes when everyone in the group doing what’s best for himself and the group” :))). The feedback which can, for example, be modeled as wasted CPU cycles and/or scheduler load can be used to train the threads i.e. a thread sleeps for an amount of time, if lock is passed by, then the thread is punished, otherwise rewarded. All details are there in the paper.
Previously, I suggested to use machine learning techniques to eliminate some issues associated with spinlock protocols that employ blocking method as well. But the model that I presented left much room for improvement. This time, I tried to generalize it further and extend it to the case of the spin-then-park method as well (when submitted, a thread does just block or just spin but spins for a while then parks itself out). Moreover, I’ve refined the model itself too. The full text can be found here. Hope you will enjoy.
DBWR and the Shared Pool
Recently, a colleague of mine, over another discussion on performance tuning in Oracle databases mentioned that he came across an interesting note from Oracle’s Data Concurrency and Consistency Concepts guide. And here is how it reads:
“Typically, a single latch protects multiple objects in the SGA. For example, background processes such as DBW and LGWR allocate memory from the shared pool to create data structures. To allocate this memory, these processes use a shared pool latch that serializes access to prevent two processes from trying to inspect or modify the shared pool simultaneously.“. Interesting, isn’t it?
The highlighted sentence is what made me curious about it. I have some ideas (which for now may be wrong) why the DBW or LGWR may want to access the shared pool. Perhaps, some wait events are associated with it too. Need to check that as well. In the next post, I’ll try to reproduce it and come up with symptoms and solutions. I believe, it is going to be a valuable troubleshooting scenario. To be continued…
Preempted Mutex Holders
While browsing through Oracle docs, an interesting troubleshooting case hit me that happened some time ago. So, I’ll briefly describe the scenario here. The case was related to mutexes and OS intervention in this.
A 24×7 11g R1 database was running on HP-UX. Eventually, there were high spikes related to Concurrency class, the top event was library cache: mutex X.
Recall, that this event is posted when a session is trying to acquire the mutex which protects a bucket in library cache in exclusive mode. The session cannot get the mutex because it is already being held in either shared or exclusive mode. Drill down of typical reasons of this wait event, such as, high hard parse rates, didn’t reveal anything. High spikes were caused by other sessions trying to repeatedly acquire the mutex. Spinning burnt CPU. There didn’t seem to be any reason for holding a mutex for long periods of time on database level.
Oracle support provides a script that can be used to find out which session is holding a mutex. The script was used to identify the holder but the session should not have kept the mutex for long time.
The next step was to suspect OS in this. On HP-UX one can use glance performance monitoring tool to check resource utilization of processes. A typical output looks like follows (the output is not related to the problem) :
The column Pri shows process priority. Whenever, a process is created it is assigned priority. The priority decides how much CPU time a process can consume. When a process is eating up too much of CPU, then the OS can lower its priority to provide fairness to other processes in the system so that they don’t starve. This is up to the OS scheduler to decide.
What caught eyes in that output then, was the fact that the priority of the process holding the mutex was very low compared to other processes. Because of resource shortage on the machine, the scheduler lowered the priority of some processes and one of these processes eventually was the one holding the mutex. This is known as priority inversion and has been dealt with in academia by quite a number of papers. In other words, the session could have released the mutex but couldn’t do it because it couldn’t jump back on CPU.
Oracle provides parameter HPUX_SCHED_NOAGE for setting priority of oracle processes with the default value of 178. This parameter was adjusted and the problem was gone. Further observations confirmed that oracle processes were assigned higher priorities which made the mutex holder to release it once it was done with it.
A New Paper on Spinlocks meeting Machine Learning
This is not performance troubleshooting post but in some sense related to that. I’ve been working on a paper where I suggest to apply reinforcement learning method of machine learning to design of spin-then-block strategy. The default behavior of latches and mutexes in recent versions of Oracle is, in fact, one implementation of the spin-then-block method. The primary idea of the paper is to have threads learn the cases where it should prefer either sleeping or spinning. The objective is to minimize cost associated with lock acquisition. The paper is out now. Unfortunately, I couldn’t make time to set up experiments to test this. However, the paper develops a self-tuning machine learning based framework that can wrap spin-then-block method. Obviously, some challenges are still there. The journal is indexed in such scientific databases as Scopus, Web of Science (ESCI) and etc. The paper is available here. Hope you will find it interesting.
Intelligent Database Management Systems
Machine Learning (ML) has been around for decades. Lots of applications of it can be provided. The idea here is to feed the agent with the ability to learn by itself. We don’t program all possible if-then-else cases but rather provide samples and the entity learns how to behave from this point on (supervised learning), or drop the entity in to an environment and then punish or reward it based on its behavior and it becomes smarter as it hits its head against the wall oftener and oftener (reinforcement leaning), or lastly given collection of data, the agent thinks about properly classifying it or splitting them into possible groups (unsupervised learning) that share similar properties. Take a look at this to see how a robot learns to flip pancakes after 50 trials. It does impress.
Database Management Systems (DBMS) have some candidate modules for integrating with ML. Query Optimizer can serve as an example of it. A query may have multiple plans for execution. The job of the optimizer is to pick up a plan with the least cost. Cost may include many metrics, such as number of I/O or number of rows processed (for In-Memory DBMS). We can treat the optimizer as agent/robot. And the system as the environment. Cost can serve as reward. The lesser the cost, the more we reward the optimizer. So, even though this time a particular cost was picked up, the optimizer will try to improve it the next time. In this way, the optimizer can learn from its behavior itself rather than being programmed for most of possible cases.
Harder to do than said. In theory, this would work. In practice….it needs a careful design and lots of experimentation. The hardest part would be to map optimizer’s behavior onto reinforcement learning paradigm. Environments are so many and very different.
Computer science associate professor in MIT Tim Kraska briefly speaks about how DBAs can be released from index management in databases if machine learning used. Once data distribution changes, it could be worth to reconsider indexes. Index management module can learn to pick up columns to be indexed as data in the database changes over time.
Recently, group of researchers and students at Carnegie Mellon University have developed a tool named OtterTune that aims at simplifying DBMS deployment. The tool has a repository that keeps data from historical tuning sessions. This experience is used then by the ML engine to develop new, appropriate recommendations for new configuration depending on application objective. In the corresponding paper, authors conduct experiments on three DBMSs: MySQL, Postgres and Vector.
Oracle introduced some adaptive features in 12c which is a step towards intelligent tuning. One of them is adaptive execution plan feature which, briefly put, works as follows. An SQL statement is executed with an initially generated plan and candidate plans are kept in the cursor of the query. Say, for a join in the query Nested Loop (NL) is the initial one. So, when the execution reaches this join point, rows are buffered and compared with initial estimates. If comparison reaches certain threshold, then the NL is replaced with Hash Join which would be a smarter decision for this case. Thus, a join method switch happens on the fly, at run time. Execution considers feedback. Subsequent executions of the same SQL query then start using this plan from then on.
Database Management Systems leave a large room for application of machine learning methods. Candidates can be query optimization, database recovery and checkpointing, memory management and instance tuning. Along with database knowledge, ML skills for future DBAs might be a plus.